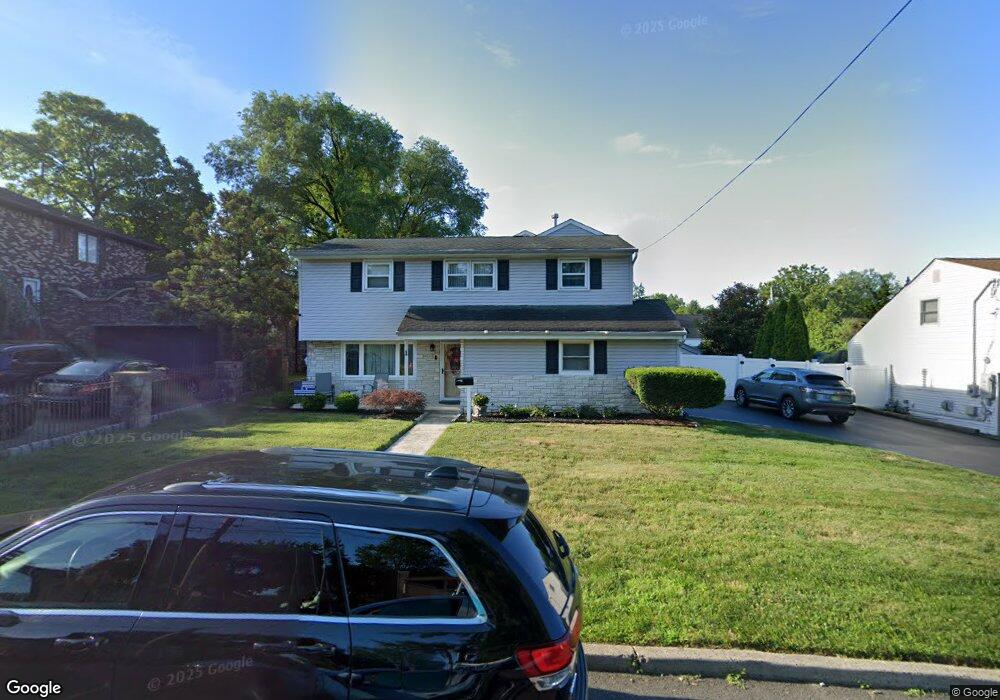
1 Otter St Hazlet, NJ 07730
Estimated Value: $599,000 - $795,000
5
Beds
3
Baths
1,993
Sq Ft
$336/Sq Ft
Est. Value
About This Home
This home is located at 1 Otter St, Hazlet, NJ 07730 and is currently estimated at $669,543, approximately $335 per square foot. 1 Otter St is a home located in Monmouth County with nearby schools including Raritan High School, St Benedict School, and Icob Academy.
Ownership History
Date
Name
Owned For
Owner Type
Purchase Details
Closed on
Oct 13, 1999
Sold by
Kane Gary
Bought by
Jelinski Ellen
Current Estimated Value
Home Financials for this Owner
Home Financials are based on the most recent Mortgage that was taken out on this home.
Original Mortgage
$125,000
Outstanding Balance
$37,743
Interest Rate
7.83%
Estimated Equity
$631,800
Purchase Details
Closed on
May 27, 1997
Sold by
Prachar Alan
Bought by
Gerstl Richar D and Gerstl Leslie
Home Financials for this Owner
Home Financials are based on the most recent Mortgage that was taken out on this home.
Original Mortgage
$154,000
Interest Rate
7.87%
Create a Home Valuation Report for This Property
The Home Valuation Report is an in-depth analysis detailing your home's value as well as a comparison with similar homes in the area
Home Values in the Area
Average Home Value in this Area
Purchase History
| Date | Buyer | Sale Price | Title Company |
|---|---|---|---|
| Jelinski Ellen | $165,000 | -- | |
| Gerstl Richar D | $162,000 | -- |
Source: Public Records
Mortgage History
| Date | Status | Borrower | Loan Amount |
|---|---|---|---|
| Open | Jelinski Ellen | $125,000 | |
| Previous Owner | Gerstl Richar D | $154,000 |
Source: Public Records
Tax History Compared to Growth
Tax History
| Year | Tax Paid | Tax Assessment Tax Assessment Total Assessment is a certain percentage of the fair market value that is determined by local assessors to be the total taxable value of land and additions on the property. | Land | Improvement |
|---|---|---|---|---|
| 2025 | $11,726 | $590,700 | $338,500 | $252,200 |
| 2024 | $11,506 | $557,600 | $306,500 | $251,100 |
| 2023 | $11,506 | $538,400 | $289,500 | $248,900 |
| 2022 | $10,604 | $454,700 | $235,500 | $219,200 |
| 2021 | $10,604 | $413,400 | $218,500 | $194,900 |
| 2020 | $10,405 | $403,000 | $212,500 | $190,500 |
| 2019 | $10,070 | $383,900 | $194,500 | $189,400 |
| 2018 | $9,789 | $370,100 | $189,500 | $180,600 |
| 2017 | $9,088 | $343,600 | $168,500 | $175,100 |
| 2016 | $8,825 | $334,900 | $166,500 | $168,400 |
| 2015 | $8,641 | $328,800 | $165,500 | $163,300 |
| 2014 | $8,274 | $295,300 | $139,500 | $155,800 |
Source: Public Records
Map
Nearby Homes