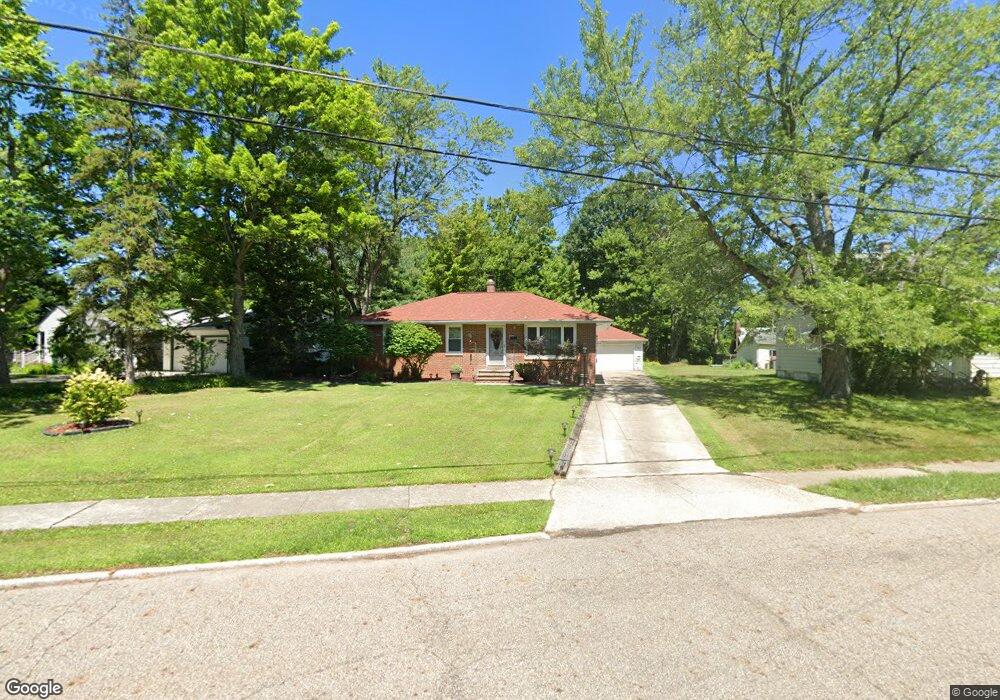
1 Overlook Place Bedford, OH 44146
Estimated Value: $166,000 - $235,000
2
Beds
3
Baths
1,335
Sq Ft
$151/Sq Ft
Est. Value
About This Home
This home is located at 1 Overlook Place, Bedford, OH 44146 and is currently estimated at $201,313, approximately $150 per square foot. 1 Overlook Place is a home located in Cuyahoga County with nearby schools including Heskett Middle School, Bedford High School, and Ohio College Preparatory School.
Ownership History
Date
Name
Owned For
Owner Type
Purchase Details
Closed on
Aug 21, 1996
Sold by
Anderson Kurt
Bought by
Quick Anthony P and Quick Yolande K
Current Estimated Value
Home Financials for this Owner
Home Financials are based on the most recent Mortgage that was taken out on this home.
Original Mortgage
$106,875
Outstanding Balance
$8,644
Interest Rate
8.47%
Mortgage Type
New Conventional
Estimated Equity
$192,669
Purchase Details
Closed on
Sep 10, 1992
Sold by
Andersen Susan Irene
Bought by
Andersen Kurt
Purchase Details
Closed on
Jun 2, 1992
Sold by
Andersen Albert Christian
Bought by
Andersen Susan Irene
Purchase Details
Closed on
Oct 23, 1987
Sold by
Viskar Miles B and Viskar Lois A
Bought by
Andersen Albert Christian
Purchase Details
Closed on
Apr 3, 1985
Sold by
Visker Miles B
Bought by
Viskar Miles B and Viskar Lois A
Purchase Details
Closed on
Jun 11, 1976
Sold by
Cigoi Edward F and Cigoi Rose M
Bought by
Visker Miles B
Purchase Details
Closed on
Jan 1, 1975
Bought by
Cigoi Edward F and Cigoi Rose M
Create a Home Valuation Report for This Property
The Home Valuation Report is an in-depth analysis detailing your home's value as well as a comparison with similar homes in the area
Home Values in the Area
Average Home Value in this Area
Purchase History
| Date | Buyer | Sale Price | Title Company |
|---|---|---|---|
| Quick Anthony P | $112,500 | -- | |
| Andersen Kurt | $75,000 | -- | |
| Andersen Susan Irene | -- | -- | |
| Andersen Albert Christian | $57,000 | -- | |
| Viskar Miles B | -- | -- | |
| Visker Miles B | $36,500 | -- | |
| Cigoi Edward F | -- | -- |
Source: Public Records
Mortgage History
| Date | Status | Borrower | Loan Amount |
|---|---|---|---|
| Open | Quick Anthony P | $106,875 |
Source: Public Records
Tax History Compared to Growth
Tax History
| Year | Tax Paid | Tax Assessment Tax Assessment Total Assessment is a certain percentage of the fair market value that is determined by local assessors to be the total taxable value of land and additions on the property. | Land | Improvement |
|---|---|---|---|---|
| 2024 | $3,873 | $50,470 | $9,905 | $40,565 |
| 2023 | $3,633 | $40,850 | $9,520 | $31,330 |
| 2022 | $3,210 | $40,850 | $9,520 | $31,330 |
| 2021 | $3,118 | $40,850 | $9,520 | $31,330 |
| 2020 | $2,588 | $30,030 | $7,000 | $23,030 |
| 2019 | $2,521 | $85,800 | $20,000 | $65,800 |
| 2018 | $2,507 | $30,030 | $7,000 | $23,030 |
| 2017 | $2,442 | $27,590 | $6,970 | $20,620 |
| 2016 | $2,421 | $27,590 | $6,970 | $20,620 |
| 2015 | $2,435 | $27,590 | $6,970 | $20,620 |
| 2014 | $2,435 | $30,000 | $7,560 | $22,440 |
Source: Public Records
Map
Nearby Homes
- 471 Columbus St
- 3011 Bluestone Ln
- 886 Archer Rd
- 733 High St
- 763 High St
- 809 Wellmon St
- 5832 Bear Creek Dr Unit 5832
- 5696 Columbia Dr
- 24051 Columbus Rd
- 639 Lincoln Blvd
- 109 Avalon Dr
- 197 Columbus St
- 52 Avalon Dr
- 24634 Staghorn Dr
- 51 Nordham Dr
- 179 Willard Ave
- 6254 Randolph Rd
- 24720 Randolph Rd
- 155 Columbus St
- 24645 Eldridge Blvd
- 11 Overlook Place
- 745 Archer Rd
- 3 Overlook Place
- 4 Overlook Place
- 2 Overlook Place
- 739 Archer Rd
- 13 Overlook Place
- 767 Archer Rd
- 748 Archer Rd
- 27 Overlook Place
- 733 Archer Rd
- 771 Archer Rd
- 30 Overlook Place
- 770 Archer Rd
- 727 Archer Rd
- 742 Archer Rd
- 33 Overlook Place
- 782 Archer Rd
- 746 Archer Rd
- 775 Archer Rd