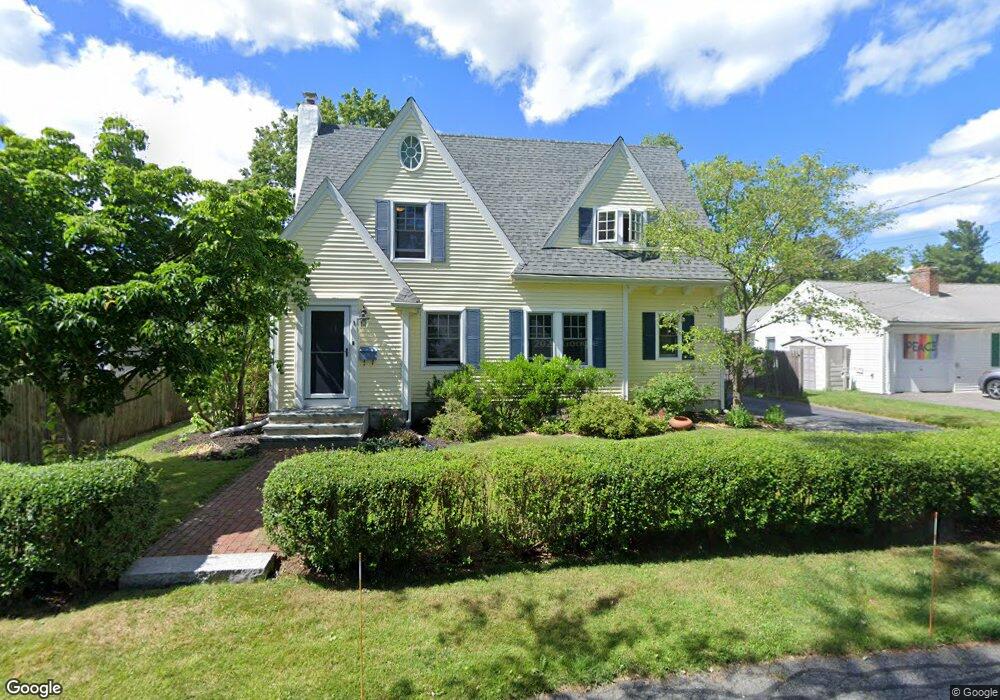
1 Payson Rd Natick, MA 01760
Estimated Value: $1,165,416 - $1,294,000
5
Beds
3
Baths
2,830
Sq Ft
$428/Sq Ft
Est. Value
About This Home
This home is located at 1 Payson Rd, Natick, MA 01760 and is currently estimated at $1,209,854, approximately $427 per square foot. 1 Payson Rd is a home located in Middlesex County with nearby schools including Natick High School, Wilson Middle School, and Bennett-Hemenway (Ben-Hem) Elementary School.
Ownership History
Date
Name
Owned For
Owner Type
Purchase Details
Closed on
Sep 15, 1999
Sold by
Formalarie Carolyn
Bought by
Stone Joseph C and Stone Diane P
Current Estimated Value
Home Financials for this Owner
Home Financials are based on the most recent Mortgage that was taken out on this home.
Original Mortgage
$238,500
Interest Rate
7.83%
Mortgage Type
Purchase Money Mortgage
Create a Home Valuation Report for This Property
The Home Valuation Report is an in-depth analysis detailing your home's value as well as a comparison with similar homes in the area
Home Values in the Area
Average Home Value in this Area
Purchase History
| Date | Buyer | Sale Price | Title Company |
|---|---|---|---|
| Stone Joseph C | $265,000 | -- |
Source: Public Records
Mortgage History
| Date | Status | Borrower | Loan Amount |
|---|---|---|---|
| Open | Stone Joseph C | $282,000 | |
| Closed | Stone Joseph C | $238,500 | |
| Previous Owner | Stone Joseph C | $25,000 |
Source: Public Records
Tax History
| Year | Tax Paid | Tax Assessment Tax Assessment Total Assessment is a certain percentage of the fair market value that is determined by local assessors to be the total taxable value of land and additions on the property. | Land | Improvement |
|---|---|---|---|---|
| 2025 | $11,734 | $981,100 | $449,600 | $531,500 |
| 2024 | $11,311 | $922,600 | $424,600 | $498,000 |
| 2023 | $10,496 | $830,400 | $399,600 | $430,800 |
| 2022 | $10,124 | $758,900 | $364,700 | $394,200 |
| 2021 | $9,728 | $714,800 | $344,700 | $370,100 |
| 2020 | $9,524 | $699,800 | $329,700 | $370,100 |
| 2019 | $8,894 | $699,800 | $329,700 | $370,100 |
| 2018 | $8,438 | $646,600 | $299,700 | $346,900 |
| 2017 | $8,163 | $605,100 | $264,800 | $340,300 |
| 2016 | $7,967 | $587,100 | $249,800 | $337,300 |
| 2015 | $7,724 | $558,900 | $249,800 | $309,100 |
Source: Public Records
Map
Nearby Homes
- 41 Charles St
- 36 Winnemay St
- 7 Jackson Ct Unit B
- 27 2nd St
- 9 Bellevue Rd
- 293 Bacon St Unit A
- 20 Florence St Unit B
- 16 Harvard St
- 142 Bacon St
- 17 Florence St
- 49 Summer St
- 89 W Central St
- 63 Pond St
- 3 Vale St Unit A
- 53 Harvard Street Extension
- 3 Wilson St Unit 3B
- 12 Bay State Rd
- 4B Lincoln St Unit 4B
- 3A Wilson St Unit 3A
- 6A Lincoln St Unit 6A
Your Personal Tour Guide
Ask me questions while you tour the home.