Estimated Value: $171,662 - $263,000
--
Bed
2
Baths
2,083
Sq Ft
$97/Sq Ft
Est. Value
About This Home
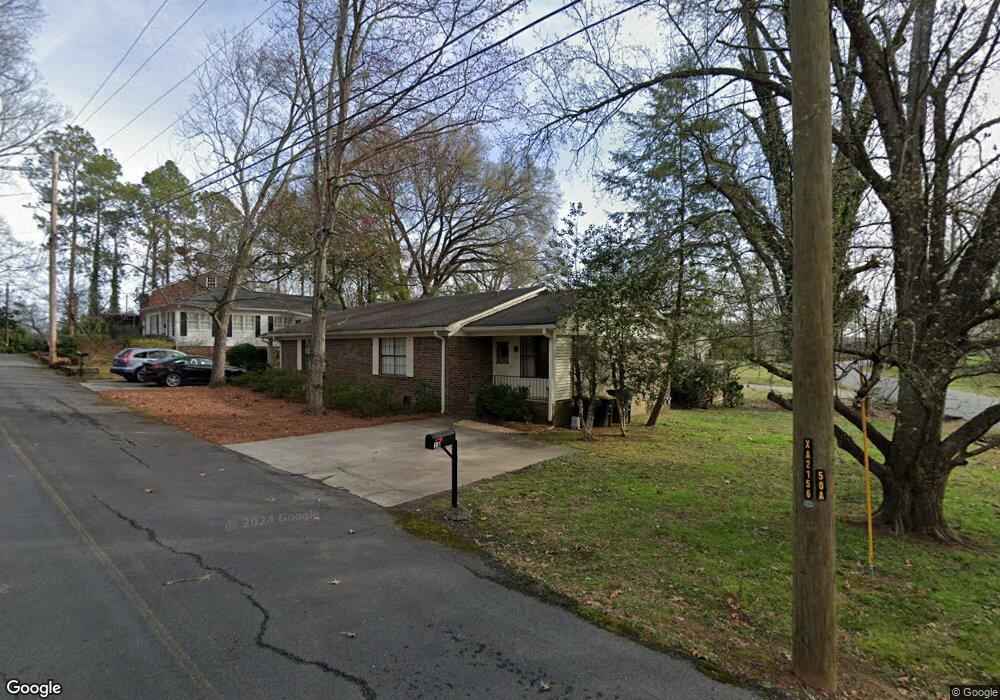
This home is located at 1 Pennington Ave SW, Rome, GA 30161 and is currently estimated at $202,166, approximately $97 per square foot. 1 Pennington Ave SW is a home located in Floyd County with nearby schools including Dan McCarty Middle School, Rome High School, and Darlington School.
Ownership History
Date
Name
Owned For
Owner Type
Purchase Details
Closed on
Nov 28, 2006
Sold by
Not Provided
Bought by
Bookaton Inc
Current Estimated Value
Purchase Details
Closed on
Feb 17, 1992
Sold by
Temple Lee Dean
Bought by
Hatch Sally K
Purchase Details
Closed on
Jul 21, 1982
Sold by
Temple Brooke J
Bought by
Temple Lee Dean
Purchase Details
Closed on
Feb 2, 1982
Sold by
Hatch Leslie R and Hatch Brooke J
Bought by
Temple Brooke J
Purchase Details
Closed on
Mar 28, 1978
Sold by
Nixon Pennington M
Bought by
Hatch Leslie R and Hatch Brooke J
Purchase Details
Closed on
Mar 7, 1978
Sold by
Nixon Challis S
Bought by
Nixon Pennington M
Purchase Details
Closed on
Feb 7, 1968
Sold by
Nixon Pennington M
Bought by
Nixon Challis S
Purchase Details
Closed on
Jun 24, 1966
Sold by
Howell Adrian
Bought by
Nixon Pennington M
Purchase Details
Closed on
Oct 1, 1963
Sold by
Woods M B
Bought by
Howell Adrian
Purchase Details
Closed on
Jan 1, 1901
Bought by
Woods M B
Create a Home Valuation Report for This Property
The Home Valuation Report is an in-depth analysis detailing your home's value as well as a comparison with similar homes in the area
Home Values in the Area
Average Home Value in this Area
Purchase History
| Date | Buyer | Sale Price | Title Company |
|---|---|---|---|
| Bookaton Inc | $2,023 | -- | |
| Hatch Sally K | -- | -- | |
| Temple Lee Dean | $67,000 | -- | |
| Temple Brooke J | $46,600 | -- | |
| Hatch Leslie R | -- | -- | |
| Nixon Pennington M | $7,500 | -- | |
| Nixon Challis S | -- | -- | |
| Nixon Pennington M | $4,400 | -- | |
| Howell Adrian | $4,500 | -- | |
| Woods M B | -- | -- |
Source: Public Records
Tax History Compared to Growth
Tax History
| Year | Tax Paid | Tax Assessment Tax Assessment Total Assessment is a certain percentage of the fair market value that is determined by local assessors to be the total taxable value of land and additions on the property. | Land | Improvement |
|---|---|---|---|---|
| 2024 | $1,925 | $50,700 | $7,712 | $42,988 |
| 2023 | $1,796 | $49,420 | $7,712 | $41,708 |
| 2022 | $1,503 | $41,182 | $7,011 | $34,171 |
| 2021 | $1,291 | $34,797 | $7,011 | $27,786 |
| 2020 | $1,249 | $33,381 | $7,011 | $26,370 |
| 2019 | $1,181 | $31,903 | $7,011 | $24,892 |
| 2018 | $1,072 | $28,947 | $7,011 | $21,936 |
| 2017 | $1,017 | $27,468 | $7,011 | $20,457 |
| 2016 | $1,006 | $27,093 | $7,000 | $20,093 |
| 2015 | $950 | $27,093 | $7,000 | $20,093 |
| 2014 | $950 | $27,093 | $7,000 | $20,093 |
Source: Public Records
Map
Nearby Homes
- 529 Branham Ave SW
- 3 Porter St SW
- 5 Jervis St SW
- 515 Harper Ave SW
- 515 Hardy Ave SW
- 111 Lookout Cir SW
- 13 N Blanche Ave SW
- 113 Lookout Cir SW
- 3 Grover St SW
- 115 Lookout Cir SW
- 107 Butler St SW
- 515 S Broad St SW
- 410 Hardy Ave SW
- 11 Blacks Bluff Rd SW
- 334 Branham Ave SW
- 110 Cherokee St SW
- 235 Pennington Ave SW
- 316 S McLin St SW
- 232 S Broad St SW
- 1 Pennington Ave SW
- 12 Wimpee St SW
- 12 Wimpee St SW
- 14 Wimpee St SW
- 16 Wimpee St SW
- 18 Wimpee St SW
- 700 S Broad St SW
- 704 S Broad St SW
- 20 Wimpee St SW
- 9 Wimpee St SW
- 710 S Broad St
- 9 Pennington Ave SW
- 636 Pennington Ave SW
- 617 S Broad St SW
- 703 S Broad St
- 703 S Broad St SW
- 620 S Broad St SW
- 634 Pennington Ave SW
- 618 S Broad St SW
- 541 Branham Ave SW