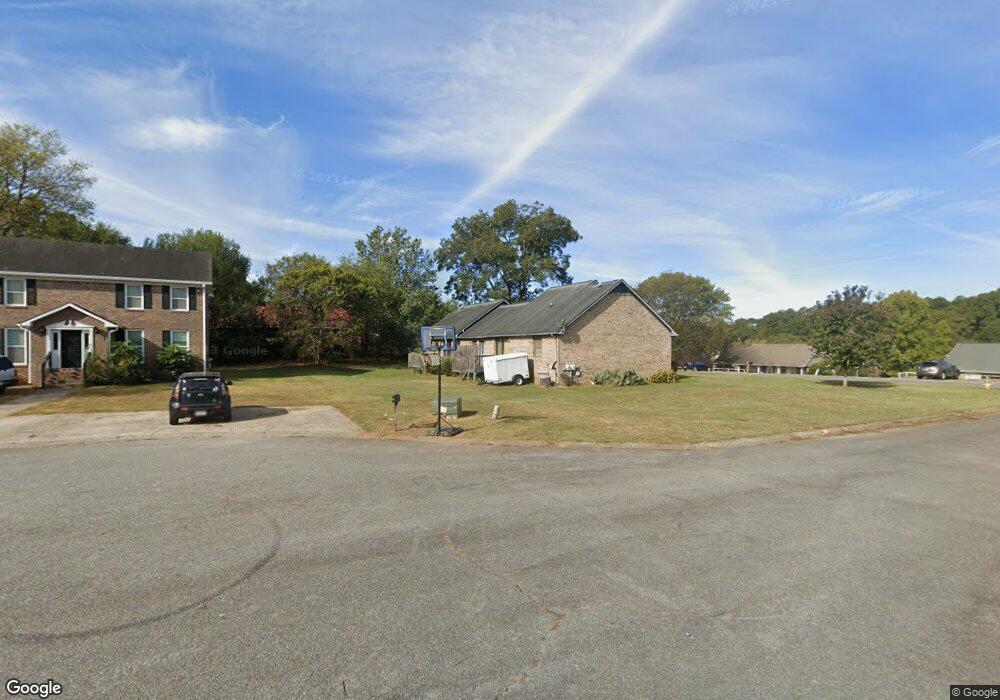
1 Penny Ct Unit 1&3 Cartersville, GA 30120
Estimated Value: $278,000 - $312,000
4
Beds
2
Baths
2,130
Sq Ft
$139/Sq Ft
Est. Value
About This Home
This home is located at 1 Penny Ct Unit 1&3, Cartersville, GA 30120 and is currently estimated at $296,617, approximately $139 per square foot. 1 Penny Ct Unit 1&3 is a home located in Bartow County with nearby schools including Kingston Elementary School, Cass Middle School, and Cass High School.
Ownership History
Date
Name
Owned For
Owner Type
Purchase Details
Closed on
Jul 27, 2018
Sold by
Crisp Matthew S
Bought by
Adalyn Joy Llc
Current Estimated Value
Purchase Details
Closed on
Sep 20, 2016
Sold by
Kevin L
Bought by
Crisp Matthew S and Crisp Darcy R
Home Financials for this Owner
Home Financials are based on the most recent Mortgage that was taken out on this home.
Original Mortgage
$80,625
Interest Rate
3.43%
Mortgage Type
Commercial
Purchase Details
Closed on
Apr 6, 2006
Sold by
Federal National Mortgage Association
Bought by
Jackson Kevin L
Home Financials for this Owner
Home Financials are based on the most recent Mortgage that was taken out on this home.
Original Mortgage
$97,200
Interest Rate
6.63%
Mortgage Type
Commercial
Purchase Details
Closed on
Dec 6, 2005
Sold by
Chase Home Finance Llc
Bought by
Federal National Mtg Associati
Create a Home Valuation Report for This Property
The Home Valuation Report is an in-depth analysis detailing your home's value as well as a comparison with similar homes in the area
Home Values in the Area
Average Home Value in this Area
Purchase History
| Date | Buyer | Sale Price | Title Company |
|---|---|---|---|
| Adalyn Joy Llc | -- | -- | |
| Crisp Matthew S | $107,500 | -- | |
| Jackson Kevin L | $108,000 | -- | |
| Federal National Mtg Associati | $111,100 | -- | |
| Chase Home Finance Llc | $111,100 | -- |
Source: Public Records
Mortgage History
| Date | Status | Borrower | Loan Amount |
|---|---|---|---|
| Previous Owner | Crisp Matthew S | $80,625 | |
| Previous Owner | Jackson Kevin L | $97,200 |
Source: Public Records
Tax History Compared to Growth
Tax History
| Year | Tax Paid | Tax Assessment Tax Assessment Total Assessment is a certain percentage of the fair market value that is determined by local assessors to be the total taxable value of land and additions on the property. | Land | Improvement |
|---|---|---|---|---|
| 2024 | $2,597 | $108,000 | $22,662 | $85,338 |
| 2023 | $2,624 | $98,450 | $20,000 | $78,450 |
| 2022 | $2,011 | $86,270 | $20,000 | $66,270 |
| 2021 | $1,489 | $67,059 | $20,000 | $47,059 |
| 2020 | $1,533 | $67,059 | $20,000 | $47,059 |
| 2019 | $1,399 | $50,390 | $12,000 | $38,390 |
| 2018 | $1,102 | $39,551 | $4,000 | $35,551 |
| 2017 | $1,107 | $39,551 | $4,000 | $35,551 |
| 2016 | $1,040 | $36,880 | $8,720 | $28,160 |
| 2015 | $1,042 | $36,880 | $8,720 | $28,160 |
| 2014 | -- | $31,600 | $8,720 | $22,880 |
| 2013 | -- | $34,400 | $8,720 | $25,680 |
Source: Public Records
Map
Nearby Homes
- 22 E Iron Belt Rd SE
- 24 E Iron Belt Rd SE
- 12 Franklin Dr
- 0 Joe Frank Harris Pkwy SE Unit 7284313
- 8 Oak Hill Cir
- 30 Luwanda Trail
- 15 Greenhouse Dr SE
- 14 Hedgerow Ct SE
- The Trenton Plan at Johnson Crossing
- 18 Hedgerow Ct SE
- 11 Paige St
- 10 Faith Ln
- 59 Middlebrook Dr
- 41 Middlebrook Dr
- 37 Middlebrook Dr
- 24 Paige St
- 108 Thornwood Dr
- 13 Otting Dr Unit A
- 101 Marion Dr
- 30 Miles Dr