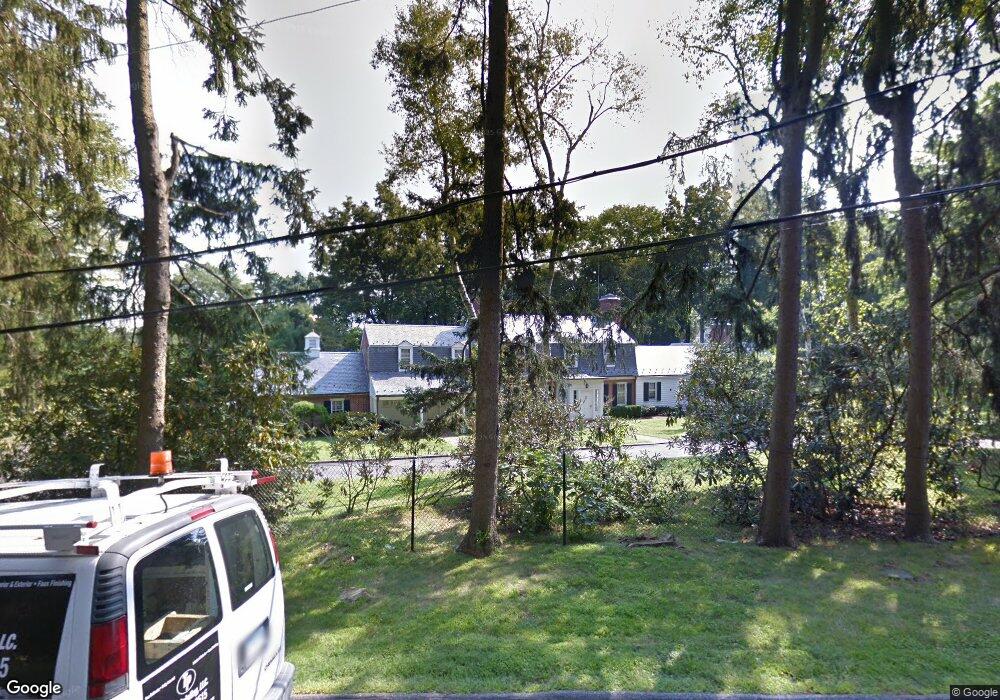
1 Pheasant Ln Greenwich, CT 06830
Mid-Country East NeighborhoodEstimated Value: $5,242,000 - $6,798,000
6
Beds
8
Baths
6,363
Sq Ft
$943/Sq Ft
Est. Value
About This Home
This home is located at 1 Pheasant Ln, Greenwich, CT 06830 and is currently estimated at $6,003,179, approximately $943 per square foot. 1 Pheasant Ln is a home located in Fairfield County with nearby schools including North Street School, Central Middle School, and Greenwich High School.
Ownership History
Date
Name
Owned For
Owner Type
Purchase Details
Closed on
Apr 3, 2024
Sold by
1 Pheasant Ln Llc
Bought by
Pearson Justine and Pearson Sethh
Current Estimated Value
Purchase Details
Closed on
Feb 27, 2006
Sold by
Miller Reed and Rooney Constance
Bought by
Chung Young Jj and Chung Rex Rk
Home Financials for this Owner
Home Financials are based on the most recent Mortgage that was taken out on this home.
Original Mortgage
$3,080,000
Interest Rate
5.25%
Mortgage Type
Purchase Money Mortgage
Purchase Details
Closed on
Jun 27, 1991
Sold by
Farley James and Farley Mary
Bought by
Miller Reed and Miller Constance
Create a Home Valuation Report for This Property
The Home Valuation Report is an in-depth analysis detailing your home's value as well as a comparison with similar homes in the area
Home Values in the Area
Average Home Value in this Area
Purchase History
| Date | Buyer | Sale Price | Title Company |
|---|---|---|---|
| Pearson Justine | $4,550,000 | None Available | |
| Pearson Justine | $4,550,000 | None Available | |
| Chung Young Jj | $3,850,000 | -- | |
| Chung Young Jj | $3,850,000 | -- | |
| Miller Reed | $1,160,000 | -- |
Source: Public Records
Mortgage History
| Date | Status | Borrower | Loan Amount |
|---|---|---|---|
| Previous Owner | Miller Reed | $3,000,000 | |
| Previous Owner | Miller Reed | $350,000 | |
| Previous Owner | Miller Reed | $3,080,000 |
Source: Public Records
Tax History Compared to Growth
Tax History
| Year | Tax Paid | Tax Assessment Tax Assessment Total Assessment is a certain percentage of the fair market value that is determined by local assessors to be the total taxable value of land and additions on the property. | Land | Improvement |
|---|---|---|---|---|
| 2025 | $42,797 | $3,462,830 | $1,142,400 | $2,320,430 |
| 2024 | $33,698 | $2,823,240 | $1,142,400 | $1,680,840 |
| 2023 | $29,425 | $2,528,820 | $1,142,400 | $1,386,420 |
| 2022 | $29,157 | $2,528,820 | $1,142,400 | $1,386,420 |
| 2021 | $33,238 | $2,760,660 | $982,800 | $1,777,860 |
| 2020 | $33,183 | $2,760,660 | $982,800 | $1,777,860 |
| 2019 | $33,514 | $2,760,660 | $982,800 | $1,777,860 |
| 2018 | $32,769 | $2,760,660 | $982,800 | $1,777,860 |
| 2017 | $33,180 | $2,760,660 | $982,800 | $1,777,860 |
| 2016 | $32,368 | $2,736,300 | $982,800 | $1,753,500 |
| 2015 | $30,617 | $2,567,460 | $1,431,710 | $1,135,750 |
| 2014 | $29,140 | $2,506,700 | $1,431,710 | $1,074,990 |
Source: Public Records
Map
Nearby Homes
- 11 Bobolink Ln
- 477 Lake Ave
- 32 Pheasant Ln
- 2 Winding Ln
- 106 Patterson Ave
- 52 Round Hill Rd
- 546 Lake Ave
- 7 Parsonage Rd
- 50 North St
- 16 Martin Dale N
- 555 Lake Ave
- 1 Prescott Ln
- 8 Fox Run Ln
- 175 Lake Ave
- 7 Perryridge Rd
- 22 Carleton St
- 636 Steamboat Rd Unit 3 A,B & E
- 10 Carleton St
- 1 Northfield St Unit B
- 65 Sherwood Place
- 1 Pheasant Ln
- 7 Pheasant Ln
- 0 Pheasant Lane Spur
- 441 N Maple Ave
- 2 Pheasant Ln
- 456 N Maple Ave
- 12 Pheasant Ln
- 80 Midwood Rd
- 9 Pheasant Lane Spur
- 5 Pheasant Lane Spur
- 100 Midwood Rd
- 11 Pheasant Ln
- 16 Pheasant Ln
- 1 Bobolink Ln
- 470 N Maple Ave
- 425 N Maple Ave
- 70 Midwood Rd
- 7 Bobolink Ln
- 422 N Maple Ave
- 16 Deer Ln