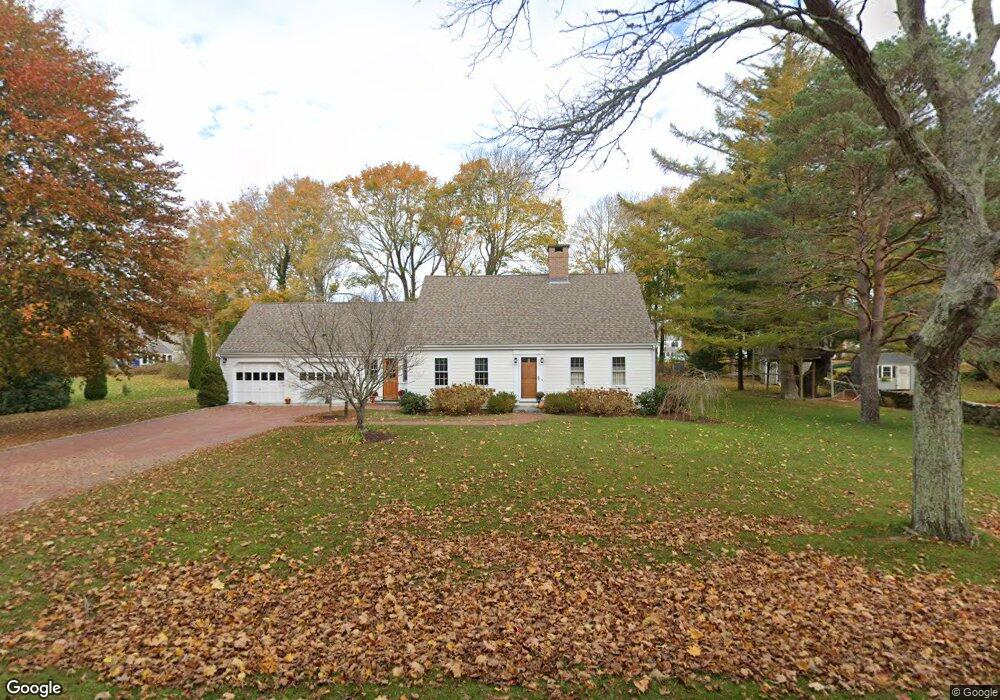
1 Pheasant Ln Sandwich, MA 02563
Estimated Value: $849,000 - $1,096,215
3
Beds
2
Baths
1,501
Sq Ft
$646/Sq Ft
Est. Value
About This Home
This home is located at 1 Pheasant Ln, Sandwich, MA 02563 and is currently estimated at $969,054, approximately $645 per square foot. 1 Pheasant Ln is a home located in Barnstable County with nearby schools including Sandwich Middle High School, Waldorf School of Cape Cod, and Bridgeview Montessori School.
Ownership History
Date
Name
Owned For
Owner Type
Purchase Details
Closed on
Feb 14, 2014
Sold by
Mcelroy Christopher V
Bought by
Mcelroy Allegra
Current Estimated Value
Purchase Details
Closed on
Feb 8, 2002
Sold by
Rohan Thomas D
Bought by
Mcelroy Christopher
Purchase Details
Closed on
Apr 29, 1988
Sold by
Mackhard Andrew B
Bought by
Rohan Thomas D
Create a Home Valuation Report for This Property
The Home Valuation Report is an in-depth analysis detailing your home's value as well as a comparison with similar homes in the area
Home Values in the Area
Average Home Value in this Area
Purchase History
| Date | Buyer | Sale Price | Title Company |
|---|---|---|---|
| Mcelroy Allegra | -- | -- | |
| Mcelroy Christopher | $280,000 | -- | |
| Rohan Thomas D | $173,000 | -- |
Source: Public Records
Mortgage History
| Date | Status | Borrower | Loan Amount |
|---|---|---|---|
| Previous Owner | Rohan Thomas D | $300,000 | |
| Previous Owner | Rohan Thomas D | $223,500 | |
| Previous Owner | Rohan Thomas D | $224,000 |
Source: Public Records
Tax History Compared to Growth
Tax History
| Year | Tax Paid | Tax Assessment Tax Assessment Total Assessment is a certain percentage of the fair market value that is determined by local assessors to be the total taxable value of land and additions on the property. | Land | Improvement |
|---|---|---|---|---|
| 2025 | $10,543 | $997,400 | $489,500 | $507,900 |
| 2024 | $8,765 | $811,600 | $437,100 | $374,500 |
| 2023 | $7,455 | $648,300 | $302,000 | $346,300 |
| 2022 | $6,880 | $522,800 | $241,300 | $281,500 |
| 2021 | $6,442 | $467,800 | $231,900 | $235,900 |
| 2020 | $6,731 | $470,400 | $246,600 | $223,800 |
| 2019 | $6,465 | $451,500 | $242,000 | $209,500 |
| 2018 | $5,937 | $415,500 | $233,700 | $181,800 |
| 2017 | $6,371 | $426,700 | $256,800 | $169,900 |
| 2016 | $5,988 | $413,800 | $248,100 | $165,700 |
| 2015 | $5,688 | $383,800 | $223,500 | $160,300 |
Source: Public Records
Map
Nearby Homes