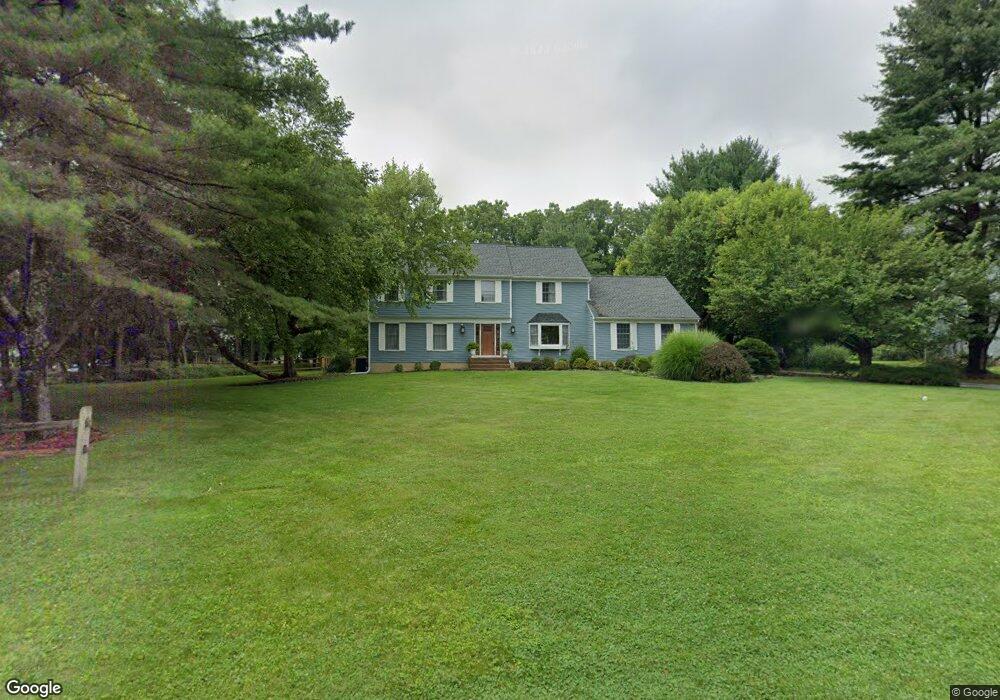
1 Pheasant Run Gladstone, NJ 07934
Estimated Value: $1,292,105 - $1,443,000
Studio
--
Bath
3,733
Sq Ft
$367/Sq Ft
Est. Value
About This Home
This home is located at 1 Pheasant Run, Gladstone, NJ 07934 and is currently estimated at $1,370,526, approximately $367 per square foot. 1 Pheasant Run is a home located in Somerset County with nearby schools including Bedwell Elementary School, Bernardsville Middle School, and Bernards High School.
Ownership History
Date
Name
Owned For
Owner Type
Purchase Details
Closed on
May 23, 2011
Sold by
Brooten Richard I and Brooten Donna Gemme
Bought by
Dusebout Kenneth E and Dusebout Kathleen M
Current Estimated Value
Home Financials for this Owner
Home Financials are based on the most recent Mortgage that was taken out on this home.
Original Mortgage
$505,000
Outstanding Balance
$351,920
Interest Rate
4.94%
Mortgage Type
New Conventional
Estimated Equity
$1,018,606
Create a Home Valuation Report for This Property
The Home Valuation Report is an in-depth analysis detailing your home's value as well as a comparison with similar homes in the area
Home Values in the Area
Average Home Value in this Area
Purchase History
| Date | Buyer | Sale Price | Title Company |
|---|---|---|---|
| Dusebout Kenneth E | $710,000 | Prestige Title Agency Inc |
Source: Public Records
Mortgage History
| Date | Status | Borrower | Loan Amount |
|---|---|---|---|
| Open | Dusebout Kenneth E | $505,000 |
Source: Public Records
Tax History
| Year | Tax Paid | Tax Assessment Tax Assessment Total Assessment is a certain percentage of the fair market value that is determined by local assessors to be the total taxable value of land and additions on the property. | Land | Improvement |
|---|---|---|---|---|
| 2025 | $14,847 | $949,800 | $367,300 | $582,500 |
| 2024 | $14,847 | $869,800 | $333,300 | $536,500 |
Source: Public Records
Map
Nearby Homes
Your Personal Tour Guide
Ask me questions while you tour the home.