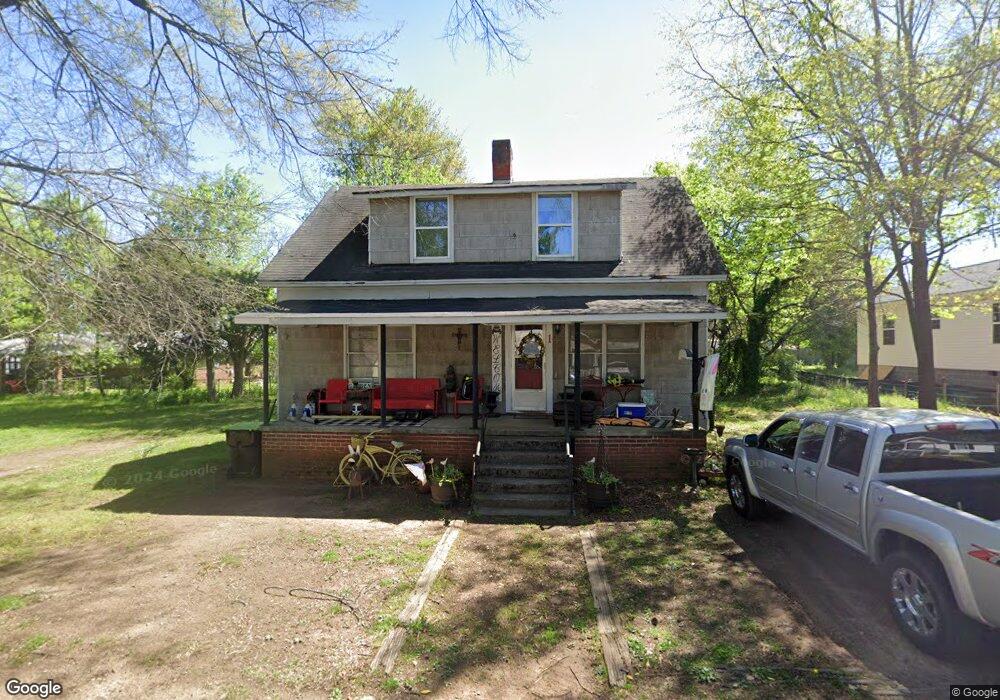
1 Pine St Aragon, GA 30104
Estimated Value: $167,816 - $189,000
2
Beds
1
Bath
1,512
Sq Ft
$119/Sq Ft
Est. Value
About This Home
This home is located at 1 Pine St, Aragon, GA 30104 and is currently estimated at $179,954, approximately $119 per square foot. 1 Pine St is a home with nearby schools including Rockmart Middle School.
Ownership History
Date
Name
Owned For
Owner Type
Purchase Details
Closed on
Nov 30, 2021
Sold by
Hutcheson Carol S
Bought by
Soles Jill and Soles Charles
Current Estimated Value
Purchase Details
Closed on
Sep 29, 2014
Sold by
Manning Russell Brett
Bought by
Statham Frank
Purchase Details
Closed on
Mar 17, 2014
Sold by
Manning Mary M
Bought by
Manning Russell Brett
Purchase Details
Closed on
Feb 26, 2014
Sold by
Manning Mary M
Bought by
Manning Mary M
Purchase Details
Closed on
Jan 11, 2001
Sold by
Manning Russell Brett
Bought by
Manning Charles E
Purchase Details
Closed on
Jan 8, 1992
Sold by
Zweilfel Gary D*
Bought by
Manning Russell B
Purchase Details
Closed on
Nov 16, 1953
Bought by
Manning James M
Create a Home Valuation Report for This Property
The Home Valuation Report is an in-depth analysis detailing your home's value as well as a comparison with similar homes in the area
Purchase History
| Date | Buyer | Sale Price | Title Company |
|---|---|---|---|
| Soles Jill | -- | -- | |
| Statham Frank | $12,000 | -- | |
| Manning Russell Brett | -- | -- | |
| Manning Mary M | -- | -- | |
| Manning Charles E | -- | -- | |
| Manning Russell B | $25,000 | -- | |
| Manning James M | -- | -- |
Source: Public Records
Tax History
| Year | Tax Paid | Tax Assessment Tax Assessment Total Assessment is a certain percentage of the fair market value that is determined by local assessors to be the total taxable value of land and additions on the property. | Land | Improvement |
|---|---|---|---|---|
| 2025 | $1,731 | $59,697 | $8,000 | $51,697 |
| 2024 | $1,712 | $59,697 | $8,000 | $51,697 |
| 2023 | $896 | $27,416 | $680 | $26,736 |
| 2022 | $554 | $23,325 | $680 | $22,645 |
| 2021 | $561 | $23,325 | $680 | $22,645 |
| 2020 | $562 | $23,325 | $680 | $22,645 |
| 2019 | $194 | $7,211 | $1,629 | $5,582 |
| 2018 | $194 | $7,043 | $1,629 | $5,414 |
| 2017 | $192 | $7,043 | $1,629 | $5,414 |
| 2016 | $183 | $6,724 | $1,629 | $5,094 |
| 2015 | $131 | $6,811 | $1,629 | $5,182 |
| 2014 | $62 | $9,544 | $1,550 | $7,994 |
Source: Public Records
Map
Nearby Homes
- 15 Aragon Rd
- 34 Elm St
- 0 Rome Hwy 101 Unit 10445422
- 30 Oak St
- 5 Magnolia St
- 3 Magnolia Blvd
- 3 Magnolia St
- 19 Walnut St
- 28 Walnut St
- 11 Magnolia St
- 54 Taylorsville Rd
- 65 Long Station Rd
- 1638 Prospect Rd
- 70 N Bellview Rd
- 156 Dogwood Glen Dr
- 88 N Bellview Rd
- 133 N Bellview Rd
- 95 Cashtown Rd
- 62 Morgan Rd
- 2300 Frettiesburg Dr
Your Personal Tour Guide
Ask me questions while you tour the home.