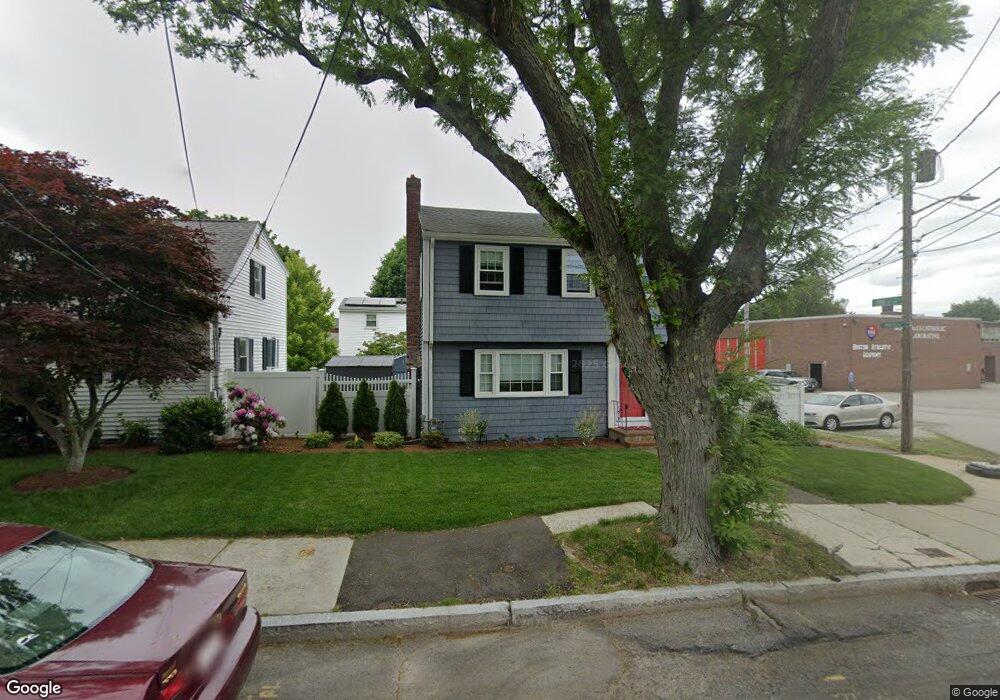
1 Pinefield Rd Hyde Park, MA 02136
Readville NeighborhoodEstimated Value: $622,791 - $704,000
3
Beds
2
Baths
1,176
Sq Ft
$561/Sq Ft
Est. Value
About This Home
This home is located at 1 Pinefield Rd, Hyde Park, MA 02136 and is currently estimated at $659,448, approximately $560 per square foot. 1 Pinefield Rd is a home located in Suffolk County with nearby schools including Boston Renaissance Charter Public School, Academy of the Pacific Rim Charter Public School, and New Beginnings Academy.
Ownership History
Date
Name
Owned For
Owner Type
Purchase Details
Closed on
Dec 2, 2022
Sold by
Carr Robert L and Carr Miriam A
Bought by
Carr Rt
Current Estimated Value
Purchase Details
Closed on
Nov 18, 2003
Sold by
Leonard Francis G
Bought by
Carr Robert L and Carr Miriam A
Home Financials for this Owner
Home Financials are based on the most recent Mortgage that was taken out on this home.
Original Mortgage
$260,000
Interest Rate
5.81%
Mortgage Type
Purchase Money Mortgage
Purchase Details
Closed on
Dec 4, 2002
Sold by
Leonard Helen T
Bought by
Leonard Frank G
Home Financials for this Owner
Home Financials are based on the most recent Mortgage that was taken out on this home.
Original Mortgage
$157,500
Interest Rate
6.34%
Mortgage Type
Purchase Money Mortgage
Create a Home Valuation Report for This Property
The Home Valuation Report is an in-depth analysis detailing your home's value as well as a comparison with similar homes in the area
Home Values in the Area
Average Home Value in this Area
Purchase History
| Date | Buyer | Sale Price | Title Company |
|---|---|---|---|
| Carr Rt | -- | None Available | |
| Carr Robert L | $325,000 | -- | |
| Leonard Frank G | $175,000 | -- |
Source: Public Records
Mortgage History
| Date | Status | Borrower | Loan Amount |
|---|---|---|---|
| Previous Owner | Carr Robert L | $260,000 | |
| Previous Owner | Carr Robert L | $75,000 | |
| Previous Owner | Leonard Frank G | $157,500 |
Source: Public Records
Tax History
| Year | Tax Paid | Tax Assessment Tax Assessment Total Assessment is a certain percentage of the fair market value that is determined by local assessors to be the total taxable value of land and additions on the property. | Land | Improvement |
|---|---|---|---|---|
| 2025 | $5,661 | $488,900 | $178,900 | $310,000 |
| 2024 | $5,264 | $482,900 | $163,400 | $319,500 |
| 2023 | $4,803 | $447,200 | $151,300 | $295,900 |
| 2022 | $4,504 | $414,000 | $140,100 | $273,900 |
| 2021 | $3,953 | $370,500 | $130,900 | $239,600 |
| 2020 | $3,607 | $341,600 | $118,700 | $222,900 |
| 2019 | $3,495 | $331,600 | $102,400 | $229,200 |
| 2018 | $3,309 | $315,700 | $102,400 | $213,300 |
| 2017 | $3,278 | $309,500 | $102,400 | $207,100 |
| 2016 | $3,243 | $294,800 | $102,400 | $192,400 |
| 2015 | $3,267 | $269,800 | $92,400 | $177,400 |
| 2014 | $3,202 | $254,500 | $92,400 | $162,100 |
Source: Public Records
Map
Nearby Homes
- 45 Como Rd
- 51 Como Rd
- 13 W Milton Place
- 000 Danny Rd
- 12 Norton St
- 1816 River St
- 1864 River St
- 1892 River St
- 1896 River St
- 71 Readville St Unit B
- 71 Readville St Unit A
- 1905 River St Unit 1905
- 24 Prescott St Unit 3
- 15 Yuill Cir Unit 2
- 241 Neponset Valley Pkwy Unit 241
- 12 Blossom St
- 51 Lancaster Rd
- 2 Leominster Rd
- 5 Lewis Farm Rd
- 72 Crane St
Your Personal Tour Guide
Ask me questions while you tour the home.