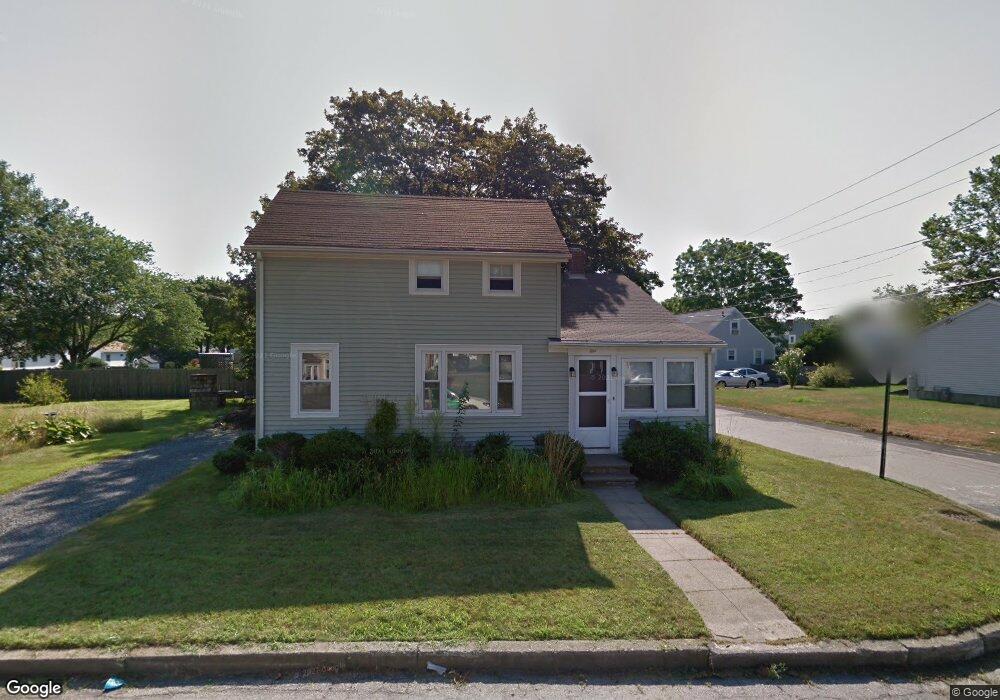
1 Plum Rd Riverside, RI 02915
Riverside NeighborhoodEstimated Value: $405,000 - $452,000
4
Beds
1
Bath
1,219
Sq Ft
$352/Sq Ft
Est. Value
About This Home
This home is located at 1 Plum Rd, Riverside, RI 02915 and is currently estimated at $429,345, approximately $352 per square foot. 1 Plum Rd is a home located in Providence County with nearby schools including East Providence High School, St Mary Academy-Bay View, and St Luke Elementary School.
Ownership History
Date
Name
Owned For
Owner Type
Purchase Details
Closed on
Apr 3, 2023
Sold by
Ohare Cara J
Bought by
Labella-Young Cara J
Current Estimated Value
Purchase Details
Closed on
Mar 18, 2003
Sold by
Scitifino Ginna
Bought by
Ohare Cara
Home Financials for this Owner
Home Financials are based on the most recent Mortgage that was taken out on this home.
Original Mortgage
$164,900
Interest Rate
5.94%
Mortgage Type
Purchase Money Mortgage
Create a Home Valuation Report for This Property
The Home Valuation Report is an in-depth analysis detailing your home's value as well as a comparison with similar homes in the area
Home Values in the Area
Average Home Value in this Area
Purchase History
| Date | Buyer | Sale Price | Title Company |
|---|---|---|---|
| Labella-Young Cara J | -- | None Available | |
| Ohare Cara | $165,000 | -- |
Source: Public Records
Mortgage History
| Date | Status | Borrower | Loan Amount |
|---|---|---|---|
| Previous Owner | Ohare Cara | $187,261 | |
| Previous Owner | Ohare Cara | $11,800 | |
| Previous Owner | Ohare Cara | $210,000 | |
| Previous Owner | Ohare Cara | $164,900 |
Source: Public Records
Tax History
| Year | Tax Paid | Tax Assessment Tax Assessment Total Assessment is a certain percentage of the fair market value that is determined by local assessors to be the total taxable value of land and additions on the property. | Land | Improvement |
|---|---|---|---|---|
| 2025 | $5,014 | $383,600 | $136,400 | $247,200 |
| 2024 | $4,978 | $324,700 | $113,700 | $211,000 |
| 2023 | $4,793 | $324,700 | $113,700 | $211,000 |
| 2022 | $4,099 | $187,500 | $60,500 | $127,000 |
| 2021 | $4,031 | $187,500 | $57,900 | $129,600 |
| 2020 | $3,861 | $187,500 | $57,900 | $129,600 |
| 2019 | $3,754 | $187,500 | $57,900 | $129,600 |
| 2018 | $3,601 | $157,400 | $56,300 | $101,100 |
| 2017 | $3,463 | $154,800 | $56,300 | $98,500 |
| 2016 | $3,446 | $154,800 | $56,300 | $98,500 |
| 2015 | $3,328 | $145,000 | $52,200 | $92,800 |
| 2014 | $3,328 | $145,000 | $52,200 | $92,800 |
Source: Public Records
Map
Nearby Homes
- 25 Winslow St
- 14 Benedict St
- 14 Winthrop St
- 103 Burnside Ave
- 151 Willett Ave Unit 2
- 15 Plaza Dr
- 85 Hilton Ave
- 15 Claire St
- 33 Pine St Unit 35
- 10 Booth Ave
- 28 Jefferson Ave
- 23 Albert Ave
- 72 Stowe Ave
- 6 Hazelton Rd
- 43 Bullocks Point Ave Unit 4A
- 65 Estrell Dr
- 41 White Ave
- 25 Bullocks Point Ave Unit 5C
- 33 Bullocks Point Ave Unit 5C
- 6 Fuller Ave
Your Personal Tour Guide
Ask me questions while you tour the home.