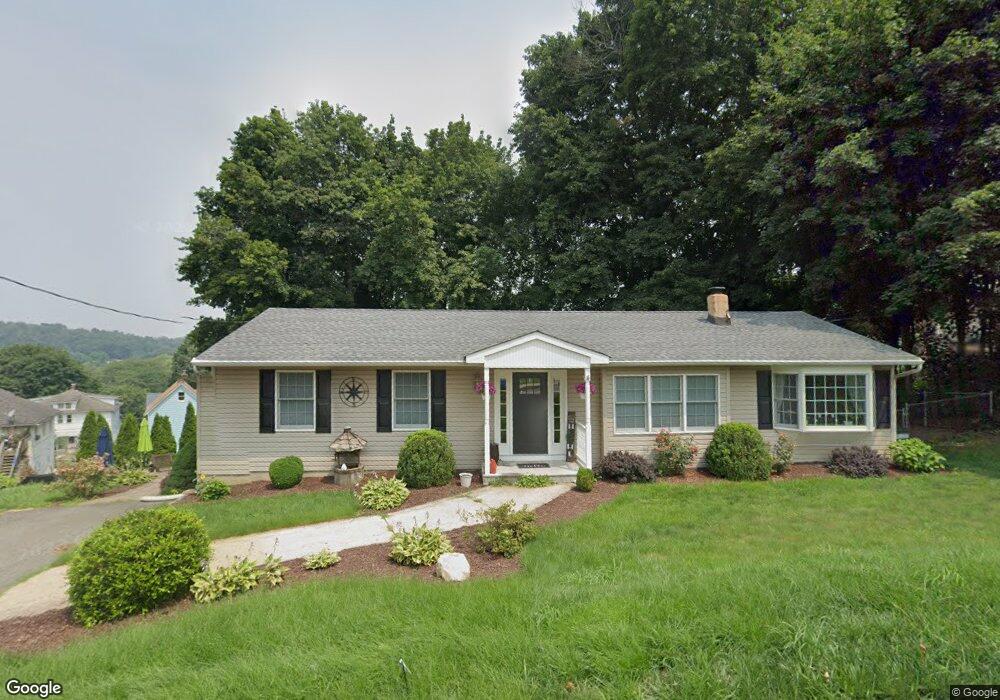
1 Prospect St Netcong, NJ 07857
Estimated Value: $453,753 - $543,000
Studio
--
Bath
1,598
Sq Ft
$316/Sq Ft
Est. Value
About This Home
This home is located at 1 Prospect St, Netcong, NJ 07857 and is currently estimated at $505,188, approximately $316 per square foot. 1 Prospect St is a home located in Morris County with nearby schools including Netcong Elementary School and Lenape Val Regional High School.
Ownership History
Date
Name
Owned For
Owner Type
Purchase Details
Closed on
Nov 26, 2002
Sold by
Koster Viola
Bought by
Moros Kevin and Moros Karen
Current Estimated Value
Home Financials for this Owner
Home Financials are based on the most recent Mortgage that was taken out on this home.
Original Mortgage
$127,200
Outstanding Balance
$54,442
Interest Rate
6.19%
Estimated Equity
$450,746
Create a Home Valuation Report for This Property
The Home Valuation Report is an in-depth analysis detailing your home's value as well as a comparison with similar homes in the area
Home Values in the Area
Average Home Value in this Area
Purchase History
| Date | Buyer | Sale Price | Title Company |
|---|---|---|---|
| Moros Kevin | $159,000 | -- |
Source: Public Records
Mortgage History
| Date | Status | Borrower | Loan Amount |
|---|---|---|---|
| Open | Moros Kevin | $127,200 |
Source: Public Records
Tax History
| Year | Tax Paid | Tax Assessment Tax Assessment Total Assessment is a certain percentage of the fair market value that is determined by local assessors to be the total taxable value of land and additions on the property. | Land | Improvement |
|---|---|---|---|---|
| 2025 | $10,374 | $303,600 | $125,700 | $177,900 |
| 2024 | $10,465 | $303,600 | $125,700 | $177,900 |
| 2023 | $10,465 | $303,600 | $125,700 | $177,900 |
| 2022 | $9,481 | $303,600 | $125,700 | $177,900 |
| 2021 | $9,481 | $303,600 | $125,700 | $177,900 |
| 2020 | $10,231 | $332,600 | $190,300 | $142,300 |
| 2019 | $9,739 | $332,600 | $190,300 | $142,300 |
| 2018 | $9,156 | $332,600 | $190,300 | $142,300 |
| 2017 | $8,797 | $332,600 | $190,300 | $142,300 |
| 2016 | $8,558 | $332,600 | $190,300 | $142,300 |
| 2015 | $8,245 | $332,600 | $190,300 | $142,300 |
| 2014 | $7,886 | $332,600 | $190,300 | $142,300 |
Source: Public Records
Map
Nearby Homes
- 35 Hillside Ave
- 60 Stoll St Unit 9
- 79 Main St
- 74 Main St
- 16-18 King St
- 58 Brooklyn Rd
- 7 Walton Place
- 4 Elizabeth Ave
- 2 Roberts Place
- 8 Hillside Ave
- 0 Lawrence Ave
- 0 Swayze Pl Lawrence Ave
- 8 Spencer St
- 37 Fox Chase Ln
- 1 Smith St
- 413 Wills Ave
- 7 Hemlock Ln
- 329 Alpine Ct Unit 29
- 573 Dell Place Unit 73
- 579 Dell Place Unit 79
Your Personal Tour Guide
Ask me questions while you tour the home.