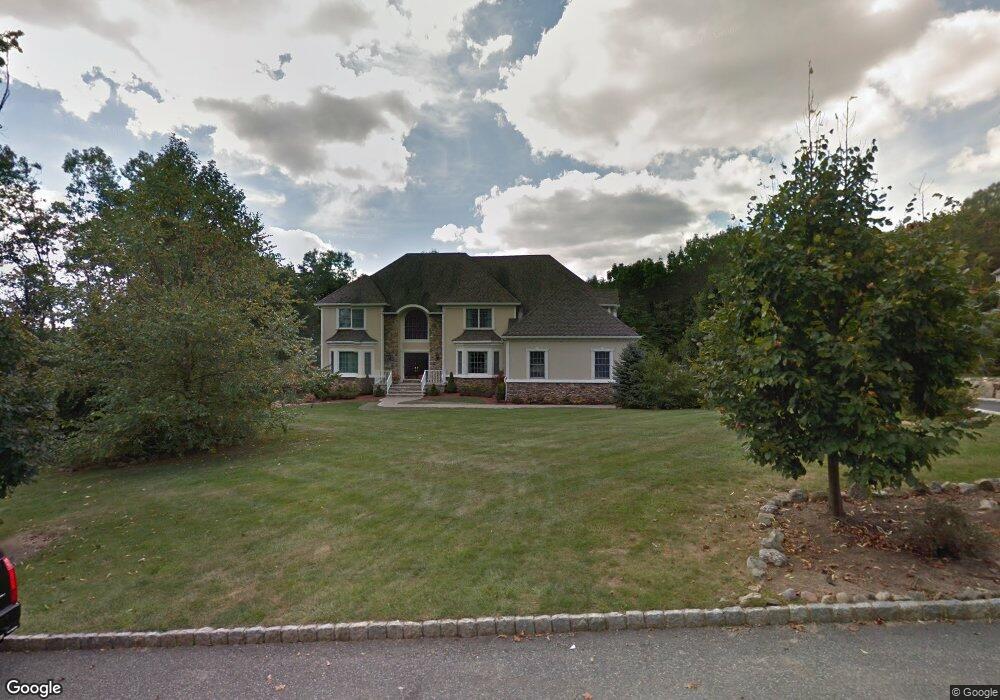
1 Rabbit Run Rockaway, NJ 07866
Estimated Value: $1,112,522 - $1,236,000
--
Bed
--
Bath
4,570
Sq Ft
$256/Sq Ft
Est. Value
About This Home
This home is located at 1 Rabbit Run, Rockaway, NJ 07866 and is currently estimated at $1,169,381, approximately $255 per square foot. 1 Rabbit Run is a home located in Morris County with nearby schools including Katherine D. Malone School, Copeland Middle School, and Divine Mercy Academy.
Ownership History
Date
Name
Owned For
Owner Type
Purchase Details
Closed on
Oct 29, 2010
Sold by
Ballentine Denise and Ballentine Oliver
Bought by
Simon Joseph and Simon Jean
Current Estimated Value
Purchase Details
Closed on
May 10, 2006
Sold by
Balletine Oliver M
Bought by
Ballentine Oliver and Ballentine Donna Jean
Purchase Details
Closed on
Sep 10, 2002
Sold by
Meriden Estates
Bought by
Ballentine Oliver and Ballentine Donna
Home Financials for this Owner
Home Financials are based on the most recent Mortgage that was taken out on this home.
Original Mortgage
$497,200
Interest Rate
6.48%
Create a Home Valuation Report for This Property
The Home Valuation Report is an in-depth analysis detailing your home's value as well as a comparison with similar homes in the area
Home Values in the Area
Average Home Value in this Area
Purchase History
| Date | Buyer | Sale Price | Title Company |
|---|---|---|---|
| Simon Joseph | $630,500 | Multiple | |
| Ballentine Oliver | -- | -- | |
| Ballentine Oliver | $680,588 | -- |
Source: Public Records
Mortgage History
| Date | Status | Borrower | Loan Amount |
|---|---|---|---|
| Previous Owner | Ballentine Oliver | $497,200 |
Source: Public Records
Tax History Compared to Growth
Tax History
| Year | Tax Paid | Tax Assessment Tax Assessment Total Assessment is a certain percentage of the fair market value that is determined by local assessors to be the total taxable value of land and additions on the property. | Land | Improvement |
|---|---|---|---|---|
| 2025 | $20,071 | $839,700 | $162,600 | $677,100 |
| 2024 | $19,239 | $782,800 | $143,100 | $639,700 |
| 2023 | $19,239 | $733,200 | $127,800 | $605,400 |
| 2022 | $18,307 | $757,400 | $180,100 | $577,300 |
| 2021 | $18,307 | $663,600 | $172,600 | $491,000 |
| 2020 | $20,168 | $709,900 | $170,100 | $539,800 |
| 2019 | $20,736 | $726,800 | $165,100 | $561,700 |
| 2018 | $20,545 | $708,700 | $170,100 | $538,600 |
| 2017 | $19,931 | $638,400 | $180,100 | $458,300 |
| 2016 | $19,675 | $638,400 | $180,100 | $458,300 |
| 2015 | $19,535 | $638,400 | $180,100 | $458,300 |
| 2014 | $19,171 | $638,400 | $180,100 | $458,300 |
Source: Public Records
Map
Nearby Homes