1 Regent Park Ct Henderson, NV 89052
Anthem Country Club NeighborhoodEstimated Value: $1,483,000 - $1,613,194
3
Beds
3
Baths
3,085
Sq Ft
$505/Sq Ft
Est. Value
About This Home
This home is located at 1 Regent Park Ct, Henderson, NV 89052 and is currently estimated at $1,558,049, approximately $505 per square foot. 1 Regent Park Ct is a home located in Clark County with nearby schools including Frank S Lamping Elementary School, Del E. Webb Middle School, and Coronado High School.
Ownership History
Date
Name
Owned For
Owner Type
Purchase Details
Closed on
Mar 9, 2023
Sold by
Redmond Keith and Redmond Paula
Bought by
Kpr Trust
Current Estimated Value
Purchase Details
Closed on
Jan 13, 2009
Sold by
Crawford Richard T
Bought by
Redmond Keith and Redmond Paula
Purchase Details
Closed on
May 15, 2008
Sold by
Stumpf Phillip P and Stumpf Patricia I
Bought by
Crawford Richard T
Purchase Details
Closed on
May 7, 2008
Sold by
Crawford Jeri S
Bought by
Crawford Richard T
Purchase Details
Closed on
Nov 28, 2000
Sold by
Terravita Home Construction Co
Bought by
Stumpf Phillip P and Stumpf Pat I
Home Financials for this Owner
Home Financials are based on the most recent Mortgage that was taken out on this home.
Original Mortgage
$397,300
Interest Rate
7.86%
Create a Home Valuation Report for This Property
The Home Valuation Report is an in-depth analysis detailing your home's value as well as a comparison with similar homes in the area
Home Values in the Area
Average Home Value in this Area
Purchase History
| Date | Buyer | Sale Price | Title Company |
|---|---|---|---|
| Kpr Trust | -- | -- | |
| Redmond Keith | $725,000 | Fidelity National Title Las | |
| Crawford Richard T | $4,700,000 | Nevada Title Company | |
| Crawford Richard T | -- | Accommodation | |
| Stumpf Phillip P | $496,654 | Del Webb Title Company Nevad |
Source: Public Records
Mortgage History
| Date | Status | Borrower | Loan Amount |
|---|---|---|---|
| Previous Owner | Stumpf Phillip P | $397,300 |
Source: Public Records
Tax History Compared to Growth
Tax History
| Year | Tax Paid | Tax Assessment Tax Assessment Total Assessment is a certain percentage of the fair market value that is determined by local assessors to be the total taxable value of land and additions on the property. | Land | Improvement |
|---|---|---|---|---|
| 2025 | $7,649 | $366,644 | $161,700 | $204,944 |
| 2024 | $7,427 | $366,644 | $161,700 | $204,944 |
| 2023 | $7,427 | $332,012 | $138,600 | $193,412 |
| 2022 | $7,561 | $290,748 | $113,575 | $177,173 |
| 2021 | $7,001 | $268,499 | $100,100 | $168,399 |
| 2020 | $6,497 | $251,826 | $84,700 | $167,126 |
| 2019 | $6,089 | $249,715 | $84,700 | $165,015 |
| 2018 | $5,810 | $244,175 | $84,700 | $159,475 |
| 2017 | $7,134 | $245,970 | $84,700 | $161,270 |
| 2016 | $5,437 | $217,861 | $53,900 | $163,961 |
| 2015 | $5,424 | $203,773 | $53,900 | $149,873 |
| 2014 | $5,256 | $176,007 | $34,650 | $141,357 |
Source: Public Records
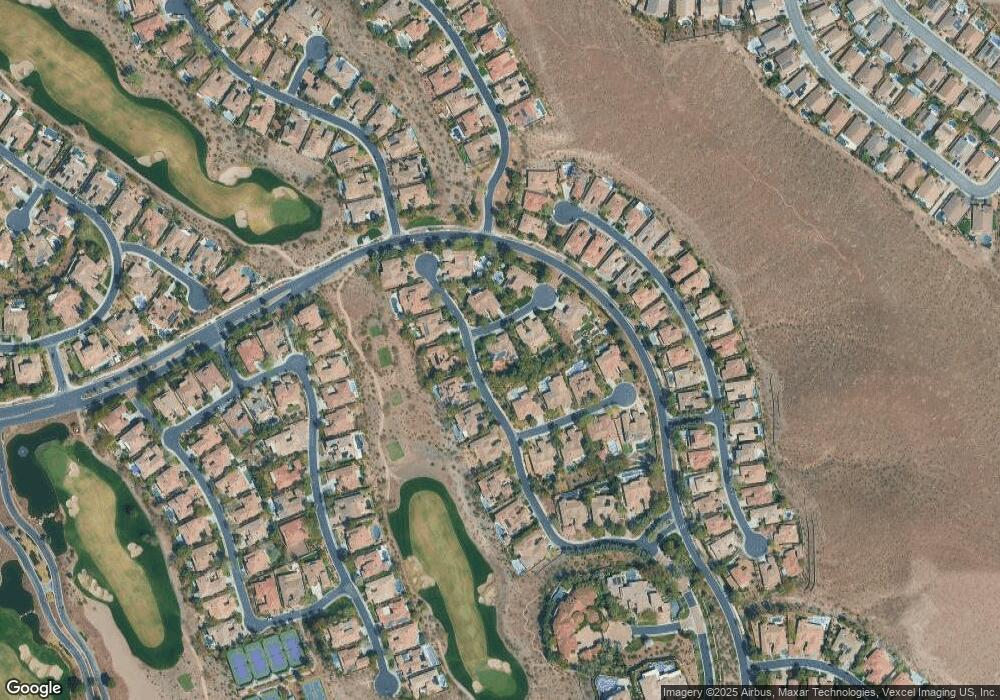
Map
Nearby Homes
- 1 Karsten Creek Ct
- 7 Moraine Dr
- 8 Marsh Landing Ct
- 2052 Sinfonia Ave
- 2 El Macero Ct
- 2045 Poetry Ave
- 17 Mountain Cove Ct
- 29 Desert Highlands Dr
- 2064 Poetry Ave
- 31 Isleworth Dr
- 9 Ibis Ct
- 9 Paradise Valley Ct
- 9 Contra Costa Place
- 4 Fox Chapel Terrace
- 2150 Ponticello Dr
- 24 Kittansett Loop
- 1350 Rossini St
- 7 Summit Walk Trail
- 2251 Tedesca Dr
- 19 Chalet Hills Terrace
- 3 Regent Park Ct
- 2 Karsten Creek Ct
- 9 Club Vista Dr
- 7 Club Vista Dr
- 2 Regent Park Ct
- 4 Karsten Creek Ct
- 11 Club Vista Dr
- 5 Club Vista Dr
- 4 Regent Park Ct
- 6 Karsten Creek Ct
- 5 Regent Park Ct
- 15 Club Vista Dr
- 2 Club Vista Dr
- 3 Club Vista Dr
- 8 Karsten Creek Ct
- 3 Karsten Creek Ct
- 3 Karsten Creek Ct Unit n/a
- 17 Club Vista Dr Unit none
- 5 Karsten Creek Ct