Estimated Value: $215,000 - $269,000
--
Bed
1
Bath
1,835
Sq Ft
$133/Sq Ft
Est. Value
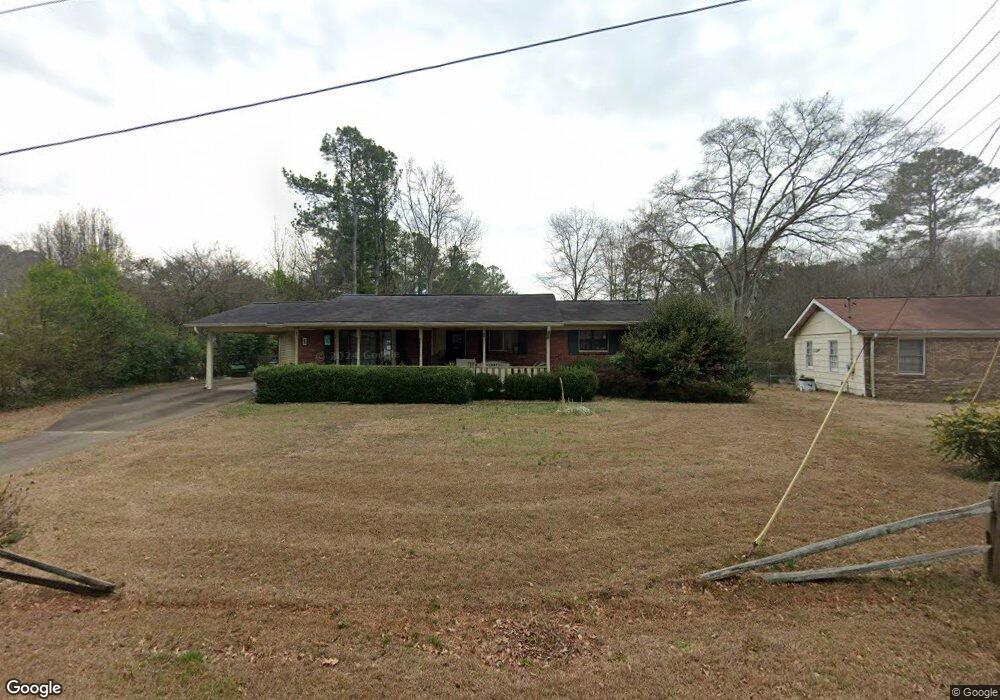
About This Home
This home is located at 1 Rice Springs Dr SW, Rome, GA 30165 and is currently estimated at $243,792, approximately $132 per square foot. 1 Rice Springs Dr SW is a home located in Floyd County with nearby schools including Coosa Middle School and Coosa High School.
Ownership History
Date
Name
Owned For
Owner Type
Purchase Details
Closed on
Aug 29, 2018
Sold by
Trapp Birma Ila
Bought by
Neighbors Allison D Trustee and Birma Ila Louise Trapp Irrev Tr
Current Estimated Value
Purchase Details
Closed on
Jul 11, 2012
Sold by
Trapp William C
Bought by
Trapp Birma Ila Louise
Purchase Details
Closed on
Mar 16, 1976
Sold by
Duffie Wm L
Bought by
Trapp Wm C
Purchase Details
Closed on
Jul 18, 1968
Sold by
Fowler J B
Bought by
Duffie Wm L
Purchase Details
Closed on
Mar 14, 1968
Sold by
P\R
Bought by
Fowler J B
Purchase Details
Closed on
Sep 13, 1966
Sold by
Culp Cecil E and Culp Linda C
Bought by
P\R
Purchase Details
Closed on
Dec 14, 1964
Sold by
Collins Marshall
Bought by
Worley Donald Alton
Purchase Details
Closed on
Jun 12, 1963
Sold by
National Land & Mortgage Co
Bought by
Collins Marshall
Purchase Details
Closed on
Feb 19, 1963
Bought by
National Land & Mortgage Co
Create a Home Valuation Report for This Property
The Home Valuation Report is an in-depth analysis detailing your home's value as well as a comparison with similar homes in the area
Home Values in the Area
Average Home Value in this Area
Purchase History
| Date | Buyer | Sale Price | Title Company |
|---|---|---|---|
| Neighbors Allison D Trustee | -- | -- | |
| Trapp Birma Ila Louise | -- | -- | |
| Trapp Wm C | $25,000 | -- | |
| Duffie Wm L | $16,800 | -- | |
| Fowler J B | $17,100 | -- | |
| P\R | -- | -- | |
| Culp Cecil E | $16,000 | -- | |
| Worley Donald Alton | -- | -- | |
| Collins Marshall | -- | -- | |
| National Land & Mortgage Co | -- | -- |
Source: Public Records
Tax History Compared to Growth
Tax History
| Year | Tax Paid | Tax Assessment Tax Assessment Total Assessment is a certain percentage of the fair market value that is determined by local assessors to be the total taxable value of land and additions on the property. | Land | Improvement |
|---|---|---|---|---|
| 2024 | $905 | $69,008 | $6,514 | $62,494 |
| 2023 | $827 | $65,658 | $5,791 | $59,867 |
| 2022 | $547 | $48,247 | $4,705 | $43,542 |
| 2021 | $438 | $42,683 | $4,705 | $37,978 |
| 2020 | $440 | $39,555 | $3,619 | $35,936 |
| 2019 | $427 | $37,512 | $3,619 | $33,893 |
| 2018 | $379 | $35,492 | $3,619 | $31,873 |
| 2017 | $379 | $34,271 | $3,619 | $30,652 |
| 2016 | $383 | $33,400 | $3,600 | $29,800 |
| 2015 | $915 | $33,400 | $3,600 | $29,800 |
| 2014 | $915 | $33,400 | $3,600 | $29,800 |
Source: Public Records
Map
Nearby Homes
- 2890 Alabama Hwy NW
- 124 Beech Creek Dr NW
- 104 Beech Creek Dr NW
- 2604 Shorter Ave NW
- 106 Eden Dr NW
- 125 Thornwood Dr SW
- 120 Thornwood Dr SW
- 7 Eden Dr NW
- 23 Bush Arbor Place SW
- 203 Hycliff Rd SW
- 3105 Barker Rd SW
- 10 Bush Arbor Place SW
- 8 Bush Arbor Place SW
- 2 Thornwood Dr SW
- 106 Kenwood Dr SW
- 121 Kenwood Dr SW
- 224 Rolling Oaks Dr NW
- 15 Ladonna Place SW
- 3 Rice Springs Dr SW
- 2 Emerson Dr SW
- 0 Rice Springs Dr SW Unit 2951287
- 0 Rice Springs Dr SW
- 5 Rice Springs Dr SW
- 1 N Kenora Dr SW
- 1 N Kenora Dr SW
- 1 N Kenora Dr SW
- 7 Rice Springs Dr SW
- 7 Rice Springs Dr SW
- 7 Rice Springs Dr SW
- 7 Rice Springs Dr SW
- 7 Rice Springs Dr SW
- 2827 Alabama Hwy SW
- 3 Emerson Dr SW
- 2 N Kenora Dr SW
- 2 N Kenora Dr SW Unit 244 & 245
- N N Kenora Dr SW Unit 79
- N N Kenora Dr SW Unit 244 & 245
- N N Kenora Dr SW