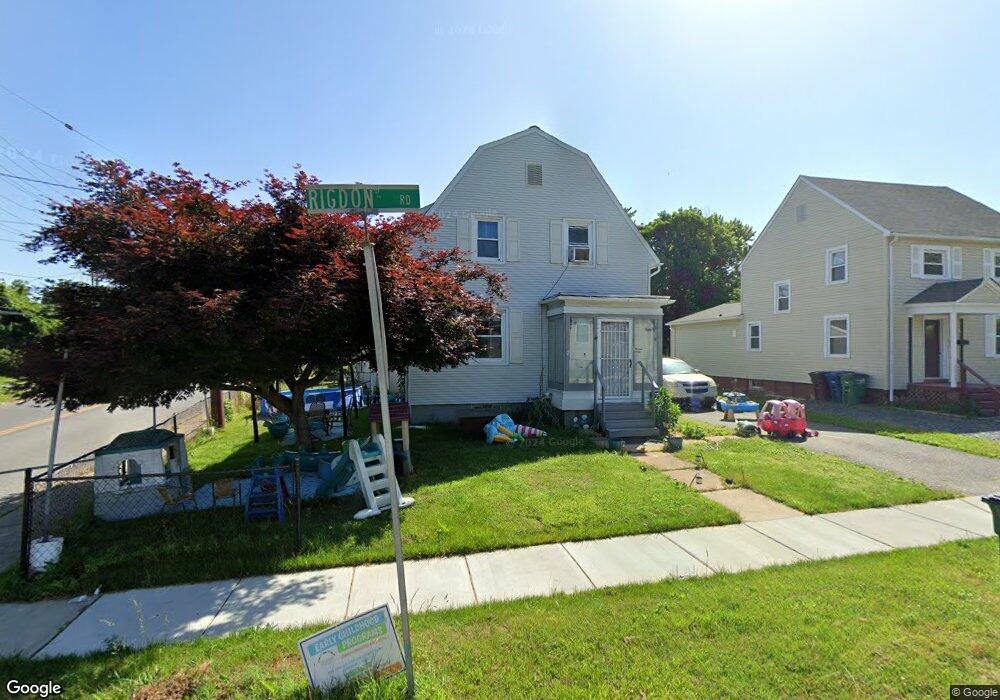
1 Rigdon Rd Aberdeen, MD 21001
Estimated Value: $201,172 - $246,000
--
Bed
1
Bath
1,056
Sq Ft
$219/Sq Ft
Est. Value
About This Home
This home is located at 1 Rigdon Rd, Aberdeen, MD 21001 and is currently estimated at $231,043, approximately $218 per square foot. 1 Rigdon Rd is a home located in Harford County with nearby schools including Halls Cross Roads Elementary School, Aberdeen Middle School, and Aberdeen High School.
Ownership History
Date
Name
Owned For
Owner Type
Purchase Details
Closed on
Feb 6, 2013
Sold by
Fallon Joseph G and Fallon Connie D
Bought by
Fallon Joseph G
Current Estimated Value
Home Financials for this Owner
Home Financials are based on the most recent Mortgage that was taken out on this home.
Original Mortgage
$70,000
Outstanding Balance
$49,002
Interest Rate
3.44%
Mortgage Type
New Conventional
Estimated Equity
$182,041
Purchase Details
Closed on
Jun 30, 1989
Sold by
Kane Ricky Gene
Bought by
Fallon Joseph G
Home Financials for this Owner
Home Financials are based on the most recent Mortgage that was taken out on this home.
Original Mortgage
$66,899
Interest Rate
10.07%
Purchase Details
Closed on
May 13, 1985
Sold by
Ennis Ora Orrie
Bought by
Kane Ricky Gene
Home Financials for this Owner
Home Financials are based on the most recent Mortgage that was taken out on this home.
Original Mortgage
$50,000
Interest Rate
13.02%
Create a Home Valuation Report for This Property
The Home Valuation Report is an in-depth analysis detailing your home's value as well as a comparison with similar homes in the area
Home Values in the Area
Average Home Value in this Area
Purchase History
| Date | Buyer | Sale Price | Title Company |
|---|---|---|---|
| Fallon Joseph G | $60,000 | Getz Title Group Llc | |
| Fallon Joseph G | $66,900 | -- | |
| Kane Ricky Gene | $50,000 | -- |
Source: Public Records
Mortgage History
| Date | Status | Borrower | Loan Amount |
|---|---|---|---|
| Open | Fallon Joseph G | $70,000 | |
| Closed | Fallon Joseph G | $66,899 | |
| Previous Owner | Kane Ricky Gene | $50,000 |
Source: Public Records
Tax History Compared to Growth
Tax History
| Year | Tax Paid | Tax Assessment Tax Assessment Total Assessment is a certain percentage of the fair market value that is determined by local assessors to be the total taxable value of land and additions on the property. | Land | Improvement |
|---|---|---|---|---|
| 2025 | $1,307 | $145,933 | $0 | $0 |
| 2024 | $1,307 | $137,067 | $0 | $0 |
| 2023 | $1,222 | $128,200 | $45,600 | $82,600 |
| 2022 | $1,202 | $126,100 | $0 | $0 |
| 2021 | $1,226 | $124,000 | $0 | $0 |
| 2020 | $1,226 | $121,900 | $45,600 | $76,300 |
| 2019 | $1,226 | $121,900 | $45,600 | $76,300 |
| 2018 | $1,215 | $121,900 | $45,600 | $76,300 |
| 2017 | $1,244 | $124,800 | $0 | $0 |
| 2016 | -- | $124,800 | $0 | $0 |
| 2015 | $1,337 | $124,800 | $0 | $0 |
| 2014 | $1,337 | $127,900 | $0 | $0 |
Source: Public Records
Map
Nearby Homes