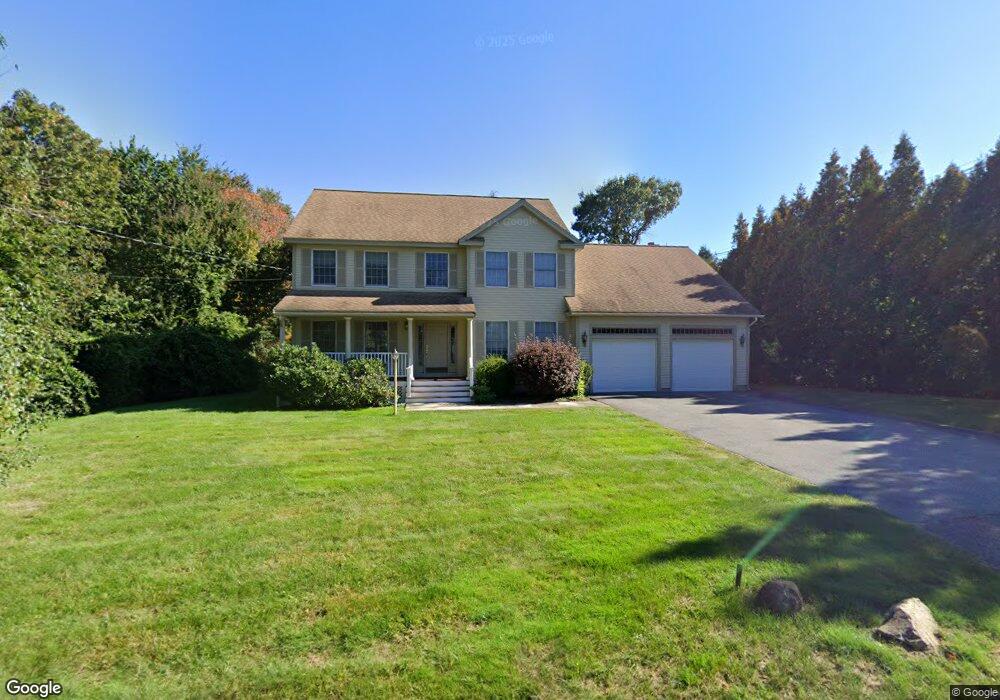
1 Rolfe Rd Lexington, MA 02420
Countryside NeighborhoodEstimated Value: $1,676,279 - $2,448,000
4
Beds
3
Baths
2,879
Sq Ft
$715/Sq Ft
Est. Value
About This Home
This home is located at 1 Rolfe Rd, Lexington, MA 02420 and is currently estimated at $2,059,570, approximately $715 per square foot. 1 Rolfe Rd is a home located in Middlesex County with nearby schools including Harrington Elementary School, William Diamond Middle School, and Lexington High School.
Ownership History
Date
Name
Owned For
Owner Type
Purchase Details
Closed on
Jul 30, 2018
Sold by
Simon Jason
Bought by
Simon Ft
Current Estimated Value
Purchase Details
Closed on
Sep 8, 2010
Sold by
Simon Joseph
Bought by
Simon Jason
Home Financials for this Owner
Home Financials are based on the most recent Mortgage that was taken out on this home.
Original Mortgage
$450,000
Interest Rate
4.55%
Purchase Details
Closed on
Jun 16, 2000
Sold by
Diprizio Anthony R and Imbornone Theresa
Bought by
Seaver Scott L
Create a Home Valuation Report for This Property
The Home Valuation Report is an in-depth analysis detailing your home's value as well as a comparison with similar homes in the area
Home Values in the Area
Average Home Value in this Area
Purchase History
| Date | Buyer | Sale Price | Title Company |
|---|---|---|---|
| Simon Ft | -- | -- | |
| Simon Jason | -- | -- | |
| Seaver Scott L | $280,000 | -- |
Source: Public Records
Mortgage History
| Date | Status | Borrower | Loan Amount |
|---|---|---|---|
| Previous Owner | Seaver Scott L | $450,000 | |
| Previous Owner | Seaver Scott L | $339,000 | |
| Previous Owner | Seaver Scott L | $450,000 | |
| Previous Owner | Simon Jason | $345,000 | |
| Previous Owner | Seaver Scott L | $249,000 |
Source: Public Records
Tax History
| Year | Tax Paid | Tax Assessment Tax Assessment Total Assessment is a certain percentage of the fair market value that is determined by local assessors to be the total taxable value of land and additions on the property. | Land | Improvement |
|---|---|---|---|---|
| 2025 | $22,112 | $1,808,000 | $861,000 | $947,000 |
| 2024 | $21,254 | $1,735,000 | $820,000 | $915,000 |
| 2023 | $19,929 | $1,533,000 | $745,000 | $788,000 |
| 2022 | $19,251 | $1,395,000 | $677,000 | $718,000 |
| 2021 | $19,398 | $1,348,000 | $618,000 | $730,000 |
| 2020 | $18,054 | $1,285,000 | $618,000 | $667,000 |
| 2019 | $18,257 | $1,293,000 | $588,000 | $705,000 |
| 2018 | $17,532 | $1,226,000 | $560,000 | $666,000 |
| 2017 | $17,287 | $1,193,000 | $548,000 | $645,000 |
| 2016 | $16,965 | $1,162,000 | $499,000 | $663,000 |
| 2015 | $16,138 | $1,086,000 | $454,000 | $632,000 |
| 2014 | $15,774 | $1,017,000 | $469,000 | $548,000 |
Source: Public Records
Map
Nearby Homes
- 15 Peachtree Rd
- 8 Blueberry Ln
- 22 Tyler Rd
- 454 Lexington St
- 28 Webb St
- 71 Webb St
- 197 Woburn St
- 218 Lowell St
- 299 Lexington St Unit 51
- 7 Whipple Rd
- 14 Liana St
- 26 Berkshire Dr
- 30 Whipple Rd
- 16 Lily Pond Ln Unit 16
- 12 Thornberry Rd
- 23 Thoreau Rd
- 5 Squire Rd
- 23 Burroughs Rd
- 197 Grant St
- 114 Johnson Rd
Your Personal Tour Guide
Ask me questions while you tour the home.