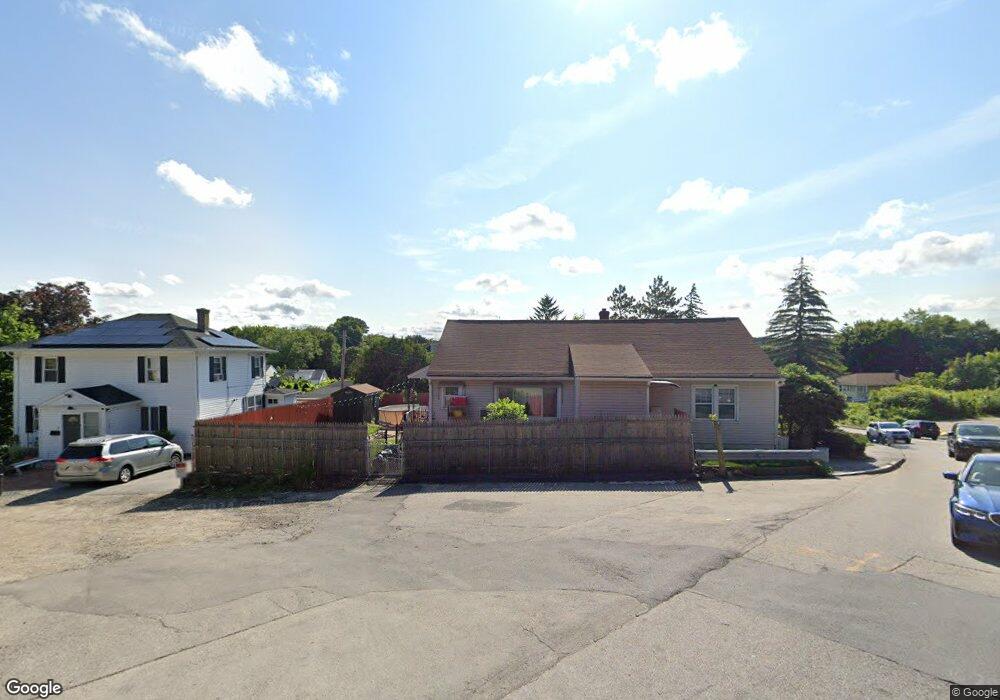
1 Rosamond St Worcester, MA 01604
Union HIll NeighborhoodEstimated Value: $394,000 - $425,000
3
Beds
1
Bath
1,215
Sq Ft
$337/Sq Ft
Est. Value
About This Home
This home is located at 1 Rosamond St, Worcester, MA 01604 and is currently estimated at $409,129, approximately $336 per square foot. 1 Rosamond St is a home located in Worcester County with nearby schools including Jacob Hiatt Magnet School, Chandler Magnet, and Union Hill School.
Ownership History
Date
Name
Owned For
Owner Type
Purchase Details
Closed on
Aug 11, 2021
Sold by
Quispe-Ortiz Jose V
Bought by
Quispe-Ortiz Jose V and Quispe Aurora
Current Estimated Value
Purchase Details
Closed on
Sep 24, 2020
Sold by
Rovan Natasha M
Bought by
Quispe-Ortiz Jose V
Home Financials for this Owner
Home Financials are based on the most recent Mortgage that was taken out on this home.
Original Mortgage
$264,127
Interest Rate
2.8%
Mortgage Type
FHA
Purchase Details
Closed on
May 28, 2015
Sold by
Caprioli Irt
Bought by
Rovan Natasha M
Home Financials for this Owner
Home Financials are based on the most recent Mortgage that was taken out on this home.
Original Mortgage
$152,486
Interest Rate
4.12%
Mortgage Type
FHA
Purchase Details
Closed on
Mar 15, 2012
Sold by
Caprioli John N
Bought by
Caprioli Irt and Carmody Christine
Create a Home Valuation Report for This Property
The Home Valuation Report is an in-depth analysis detailing your home's value as well as a comparison with similar homes in the area
Home Values in the Area
Average Home Value in this Area
Purchase History
| Date | Buyer | Sale Price | Title Company |
|---|---|---|---|
| Quispe-Ortiz Jose V | -- | None Available | |
| Quispe-Ortiz Jose V | $269,000 | None Available | |
| Rovan Natasha M | $155,300 | -- | |
| Caprioli Irt | -- | -- |
Source: Public Records
Mortgage History
| Date | Status | Borrower | Loan Amount |
|---|---|---|---|
| Previous Owner | Quispe-Ortiz Jose V | $264,127 | |
| Previous Owner | Rovan Natasha M | $152,486 |
Source: Public Records
Tax History Compared to Growth
Tax History
| Year | Tax Paid | Tax Assessment Tax Assessment Total Assessment is a certain percentage of the fair market value that is determined by local assessors to be the total taxable value of land and additions on the property. | Land | Improvement |
|---|---|---|---|---|
| 2025 | $4,801 | $364,000 | $81,700 | $282,300 |
| 2024 | $4,654 | $338,500 | $81,700 | $256,800 |
| 2023 | $4,537 | $316,400 | $71,000 | $245,400 |
| 2022 | $4,037 | $265,400 | $56,800 | $208,600 |
| 2021 | $3,502 | $215,100 | $45,500 | $169,600 |
| 2020 | $3,485 | $205,000 | $45,200 | $159,800 |
| 2019 | $3,244 | $180,200 | $39,400 | $140,800 |
| 2018 | $3,109 | $164,400 | $39,400 | $125,000 |
| 2017 | $3,160 | $164,400 | $39,400 | $125,000 |
| 2016 | $3,145 | $152,600 | $28,500 | $124,100 |
| 2015 | $2,996 | $149,300 | $28,500 | $120,800 |
| 2014 | $2,917 | $149,300 | $28,500 | $120,800 |
Source: Public Records
Map
Nearby Homes
- 26 Derby St
- 58 Granite St
- 47 Acton St
- 10 Rutledge St Unit 3G
- 36,38,38.5 Houghton St
- 42 Bridgeport St
- 8 Taunton St
- 55 Mendon St
- 8 Beaumont Rd
- 4 Everton Ave
- 59 Barclay St
- 17 Plantation St
- 423 Grafton St Unit 7
- 40 Aetna St
- 35 Houghton St
- 247 Pilgrim Ave
- 9 Winthrop St
- 7 Winthrop St
- 96 Vernon St
- Lot 1 Stockton St
- 1 Rosamond St
- 1 Rosamond St Unit A
- 1B Rosamond St
- 69 Heywood St
- 67 Heywood St
- 2 Rosamond St
- 3 Rosamond St
- 5 Rosamond St
- 81 Heywood St
- 6 Rosamond St
- 64 Heywood St
- 59 Heywood St
- 83 Heywood St
- 120 Houghton St
- 10 Nuttall Ln Unit 5.1
- 10 Nuttall Ln Unit 15
- 10 Nuttall Ln Unit 14
- 10 Nuttall Ln Unit 13
- 10 Nuttall Ln Unit 12
- 10 Nuttall Ln Unit 11