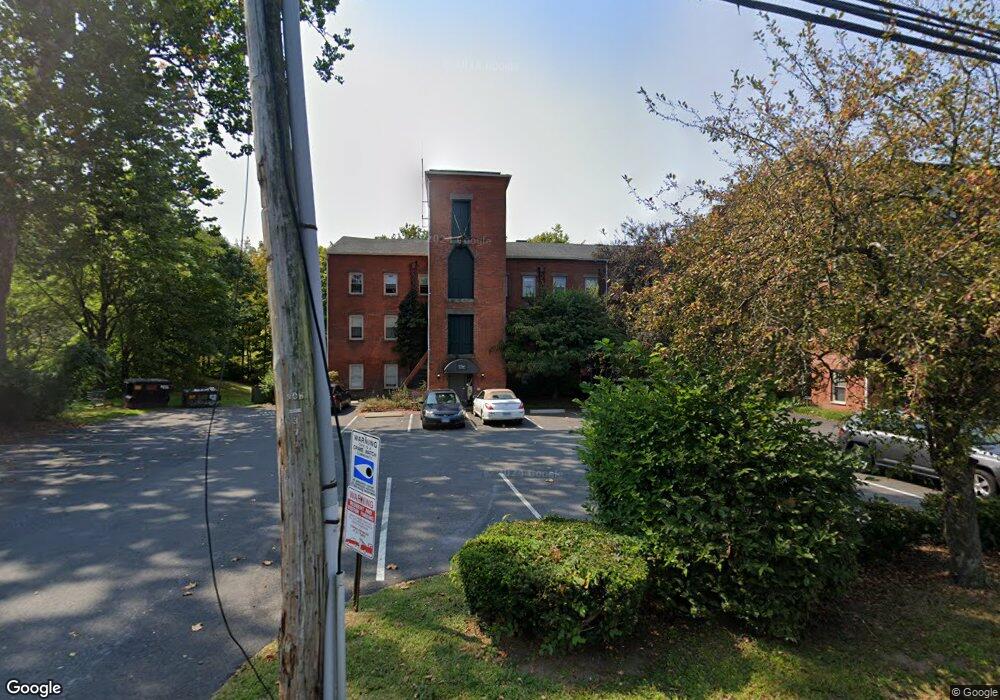
1 Russell St Unit 3 Middletown, CT 06457
Estimated Value: $129,000 - $162,954
2
Beds
1
Bath
1,008
Sq Ft
$149/Sq Ft
Est. Value
About This Home
This home is located at 1 Russell St Unit 3, Middletown, CT 06457 and is currently estimated at $149,739, approximately $148 per square foot. 1 Russell St Unit 3 is a home located in Middlesex County with nearby schools including Farm Hill School, St John Paul II School, and Mercy High School.
Ownership History
Date
Name
Owned For
Owner Type
Purchase Details
Closed on
Nov 5, 2020
Sold by
Herman Jason E
Bought by
Cacaci Nicholas V
Current Estimated Value
Purchase Details
Closed on
Jun 18, 2007
Sold by
Walsh Gregory W
Bought by
Herman Jason E
Home Financials for this Owner
Home Financials are based on the most recent Mortgage that was taken out on this home.
Original Mortgage
$73,600
Interest Rate
6.19%
Purchase Details
Closed on
Oct 4, 2004
Sold by
Dixon Richard E and Dixon Nellie M
Bought by
Walsh Gregory W
Home Financials for this Owner
Home Financials are based on the most recent Mortgage that was taken out on this home.
Original Mortgage
$65,930
Interest Rate
5.81%
Purchase Details
Closed on
Apr 25, 1990
Sold by
Fisher James F
Bought by
Dixon Richard E
Home Financials for this Owner
Home Financials are based on the most recent Mortgage that was taken out on this home.
Original Mortgage
$12,960
Interest Rate
10.26%
Create a Home Valuation Report for This Property
The Home Valuation Report is an in-depth analysis detailing your home's value as well as a comparison with similar homes in the area
Home Values in the Area
Average Home Value in this Area
Purchase History
| Date | Buyer | Sale Price | Title Company |
|---|---|---|---|
| Cacaci Nicholas V | $40,500 | None Available | |
| Herman Jason E | $92,000 | -- | |
| Walsh Gregory W | $69,400 | -- | |
| Dixon Richard E | $69,000 | -- |
Source: Public Records
Mortgage History
| Date | Status | Borrower | Loan Amount |
|---|---|---|---|
| Previous Owner | Dixon Richard E | $73,600 | |
| Previous Owner | Dixon Richard E | $65,930 | |
| Previous Owner | Dixon Richard E | $12,960 |
Source: Public Records
Tax History Compared to Growth
Tax History
| Year | Tax Paid | Tax Assessment Tax Assessment Total Assessment is a certain percentage of the fair market value that is determined by local assessors to be the total taxable value of land and additions on the property. | Land | Improvement |
|---|---|---|---|---|
| 2025 | $2,086 | $56,370 | $0 | $56,370 |
| 2024 | $1,996 | $56,370 | $0 | $56,370 |
| 2023 | $1,895 | $56,370 | $0 | $56,370 |
| 2022 | $1,462 | $35,450 | $0 | $35,450 |
| 2021 | $1,456 | $35,450 | $0 | $35,450 |
| 2020 | $1,454 | $35,450 | $0 | $35,450 |
| 2019 | $1,461 | $35,450 | $0 | $35,450 |
| 2018 | $1,410 | $35,450 | $0 | $35,450 |
| 2017 | $1,557 | $40,240 | $0 | $40,240 |
| 2016 | $1,525 | $40,240 | $0 | $40,240 |
| 2015 | $1,492 | $40,240 | $0 | $40,240 |
| 2014 | $1,490 | $40,240 | $0 | $40,240 |
Source: Public Records
Map
Nearby Homes
- 1 Russell St Unit 15
- 1 Russell St Unit 11
- 4 Hillside Ct
- 154 Front St
- 56 Bidwell Terrace
- 42 Saybrook Rd
- 37 Front St
- 10 Wall St
- 30 Denison Rd
- 50 Garfield Ave
- 77 Lindsey Rd
- 73 Durant St
- 10 Silver St
- 58 Durant Terrace
- 66 Durant Terrace
- 43 Silver St
- 47 Silver St
- 40 Maple Place
- 19 Fairlawn Ave
- 102 Main Street Extension
- 1 Russell St Unit 9
- 1 Russell St Unit 5
- 1 Russell St Unit 12
- 1 Russell St Unit 2
- 1 Russell St
- 1 Russell St Unit 7
- 1 Russell St Unit 17
- 1 Russell St Unit 6
- 1 Russell St Unit 8
- 1 Russell St Unit 22
- 1 Russell St Unit 16
- 1 Russell St Unit 10
- 1 Russell St Unit 19
- 1 Russell St Unit 14
- 1 Russell St Unit 21
- 1 Russell St Unit 20
- 1 Russell St Unit 4
- 1 Russell St Unit 13
- 1 Russell St Unit 18
- 1 Russell St Unit 1