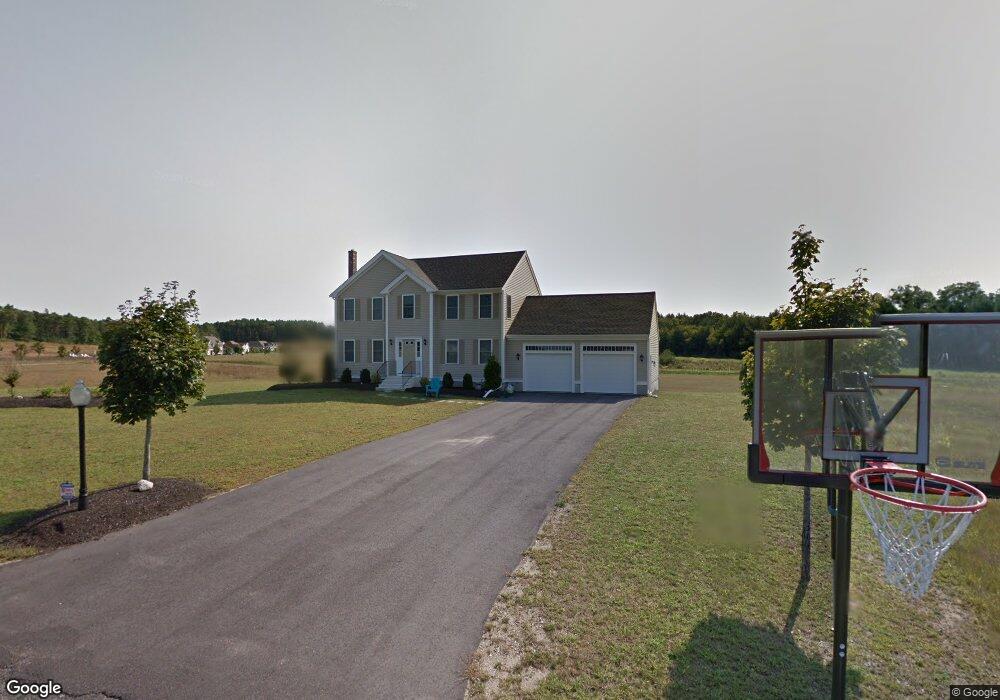
1 Rylee Cir East Freetown, MA 02717
Estimated Value: $677,511 - $849,000
4
Beds
3
Baths
2,016
Sq Ft
$367/Sq Ft
Est. Value
About This Home
This home is located at 1 Rylee Cir, East Freetown, MA 02717 and is currently estimated at $740,378, approximately $367 per square foot. 1 Rylee Cir is a home located in Bristol County with nearby schools including Freetown Elementary School, George R Austin Intermediate School, and Freetown-Lakeville Middle School.
Ownership History
Date
Name
Owned For
Owner Type
Purchase Details
Closed on
Jan 27, 2011
Sold by
Malloch Const Co Inc
Bought by
Couto Steven A and Couto Claribel
Current Estimated Value
Home Financials for this Owner
Home Financials are based on the most recent Mortgage that was taken out on this home.
Original Mortgage
$310,700
Outstanding Balance
$211,550
Interest Rate
4.83%
Mortgage Type
Purchase Money Mortgage
Estimated Equity
$528,828
Create a Home Valuation Report for This Property
The Home Valuation Report is an in-depth analysis detailing your home's value as well as a comparison with similar homes in the area
Home Values in the Area
Average Home Value in this Area
Purchase History
| Date | Buyer | Sale Price | Title Company |
|---|---|---|---|
| Couto Steven A | $350,700 | -- |
Source: Public Records
Mortgage History
| Date | Status | Borrower | Loan Amount |
|---|---|---|---|
| Open | Couto Steven A | $20,000 | |
| Open | Couto Steven A | $310,700 |
Source: Public Records
Tax History Compared to Growth
Tax History
| Year | Tax Paid | Tax Assessment Tax Assessment Total Assessment is a certain percentage of the fair market value that is determined by local assessors to be the total taxable value of land and additions on the property. | Land | Improvement |
|---|---|---|---|---|
| 2025 | $6,100 | $615,500 | $188,200 | $427,300 |
| 2024 | $6,108 | $585,600 | $177,500 | $408,100 |
| 2023 | $6,002 | $560,400 | $159,900 | $400,500 |
| 2022 | $5,773 | $478,700 | $135,400 | $343,300 |
| 2021 | $5,592 | $440,300 | $123,100 | $317,200 |
| 2020 | $5,586 | $429,000 | $118,400 | $310,600 |
| 2019 | $5,315 | $404,200 | $112,800 | $291,400 |
| 2018 | $5,026 | $377,600 | $112,800 | $264,800 |
| 2017 | $4,906 | $368,300 | $112,800 | $255,500 |
| 2016 | $4,716 | $360,300 | $109,600 | $250,700 |
| 2015 | $4,619 | $358,100 | $109,600 | $248,500 |
| 2014 | $4,459 | $353,600 | $107,300 | $246,300 |
Source: Public Records
Map
Nearby Homes
- 0 Costa Dr
- 144 Chace Rd
- 9 Paul Ave
- 4597 Acushnet Ave
- 599 Quanapoag Rd
- 24 Bells Brook Rd
- 1475 Braley Rd Unit 17
- 13 Luscomb Ln
- 195 Slab Bridge Rd
- 16 Swallow St
- 1069 Cherokee St
- 319 Northwest St
- 150 Quanapoag Rd
- 5 Freetown St
- 269 Middleboro Rd
- 64 Blaze Rd
- Lot 2/3 Quanapoag Rd
- 3 Abraham Ave
- 34 Poplar Rd
- 50 Blueberry Dr