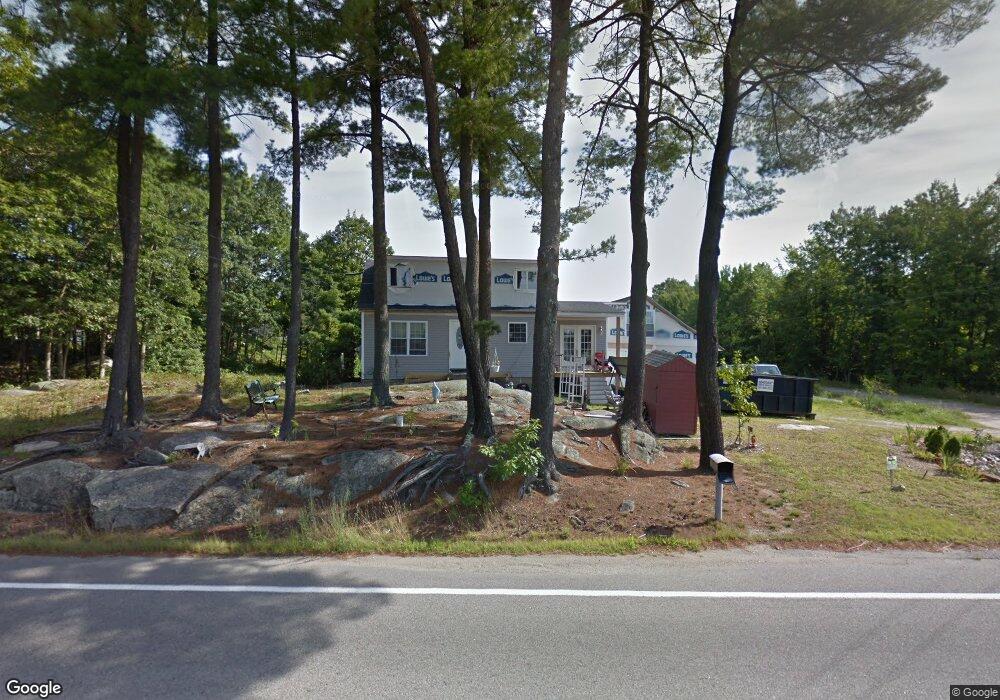
1 Sable Ln Biddeford, ME 04005
South Biddeford NeighborhoodEstimated Value: $384,000 - $455,000
3
Beds
1
Bath
1,080
Sq Ft
$384/Sq Ft
Est. Value
About This Home
This home is located at 1 Sable Ln, Biddeford, ME 04005 and is currently estimated at $415,226, approximately $384 per square foot. 1 Sable Ln is a home located in York County with nearby schools including John F Kennedy Memorial School, Biddeford Primary School, and Biddeford Intermediate School.
Ownership History
Date
Name
Owned For
Owner Type
Purchase Details
Closed on
Mar 5, 2021
Sold by
Mann Enterprise Inc
Bought by
Collins Courtney S and Collins Jeffery R
Current Estimated Value
Home Financials for this Owner
Home Financials are based on the most recent Mortgage that was taken out on this home.
Original Mortgage
$276,000
Outstanding Balance
$246,288
Interest Rate
2.7%
Mortgage Type
Purchase Money Mortgage
Estimated Equity
$168,938
Create a Home Valuation Report for This Property
The Home Valuation Report is an in-depth analysis detailing your home's value as well as a comparison with similar homes in the area
Home Values in the Area
Average Home Value in this Area
Purchase History
| Date | Buyer | Sale Price | Title Company |
|---|---|---|---|
| Collins Courtney S | -- | None Available | |
| Collins Courtney S | -- | None Available | |
| Collins Courtney S | -- | None Available |
Source: Public Records
Mortgage History
| Date | Status | Borrower | Loan Amount |
|---|---|---|---|
| Open | Collins Courtney S | $276,000 | |
| Closed | Collins Courtney S | $276,000 |
Source: Public Records
Tax History
| Year | Tax Paid | Tax Assessment Tax Assessment Total Assessment is a certain percentage of the fair market value that is determined by local assessors to be the total taxable value of land and additions on the property. | Land | Improvement |
|---|---|---|---|---|
| 2024 | $4,098 | $288,200 | $173,700 | $114,500 |
| 2023 | $3,739 | $285,000 | $170,500 | $114,500 |
| 2022 | $3,435 | $209,300 | $96,000 | $113,300 |
| 2021 | $3,234 | $177,400 | $81,100 | $96,300 |
| 2020 | $2,306 | $139,500 | $73,900 | $65,600 |
| 2019 | $2,787 | $139,500 | $73,900 | $65,600 |
| 2018 | $7,646 | $139,500 | $73,900 | $65,600 |
| 2017 | $3,611 | $134,400 | $73,900 | $60,500 |
| 2016 | $2,669 | $134,400 | $73,900 | $60,500 |
| 2015 | $2,422 | $134,400 | $73,900 | $60,500 |
| 2014 | $2,528 | $133,100 | $73,900 | $59,200 |
| 2013 | -- | $124,900 | $65,100 | $59,800 |
Source: Public Records
Map
Nearby Homes