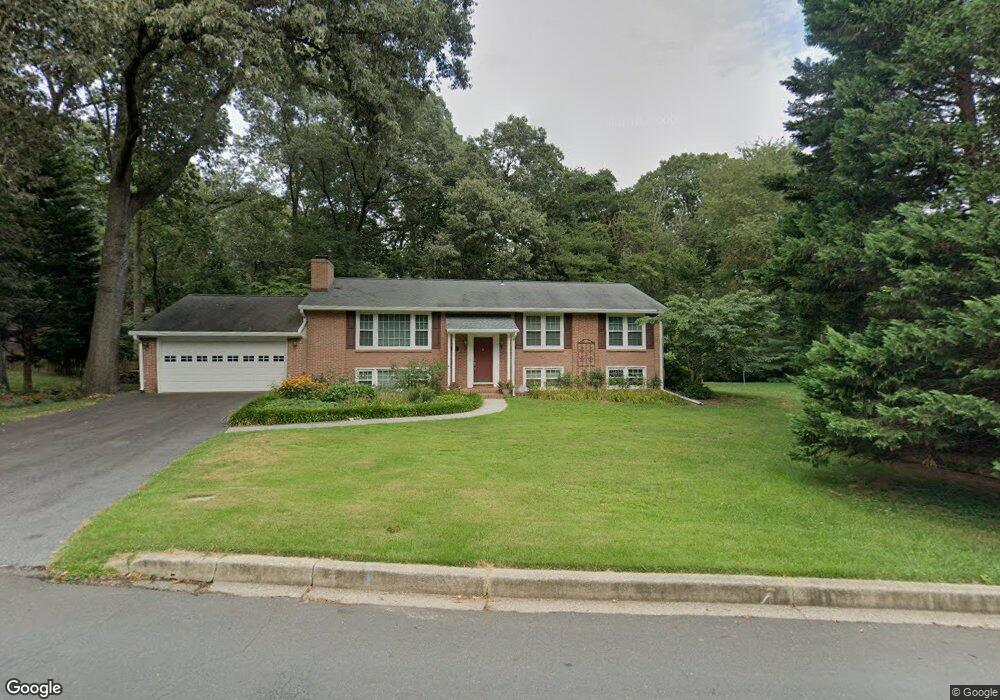
1 Saint Andrews Crossover Severna Park, MD 21146
Estimated Value: $641,000 - $736,000
--
Bed
3
Baths
1,378
Sq Ft
$500/Sq Ft
Est. Value
About This Home
This home is located at 1 Saint Andrews Crossover, Severna Park, MD 21146 and is currently estimated at $689,455, approximately $500 per square foot. 1 Saint Andrews Crossover is a home located in Anne Arundel County with nearby schools including Benfield Elementary School, Severna Park Middle School, and Severna Park High School.
Ownership History
Date
Name
Owned For
Owner Type
Purchase Details
Closed on
Jun 24, 2021
Sold by
Woods Francis D
Bought by
Woods Francis D and Woods Mary D
Current Estimated Value
Home Financials for this Owner
Home Financials are based on the most recent Mortgage that was taken out on this home.
Original Mortgage
$414,000
Interest Rate
2.9%
Mortgage Type
New Conventional
Purchase Details
Closed on
May 22, 2011
Sold by
Woods Francis D and Woods Mary D
Bought by
Woods Rachelle Marie and Woods Heather Dawn
Home Financials for this Owner
Home Financials are based on the most recent Mortgage that was taken out on this home.
Original Mortgage
$308,000
Interest Rate
4.82%
Mortgage Type
New Conventional
Purchase Details
Closed on
Apr 22, 2011
Sold by
Woods Francis D and Woods Mary D
Bought by
Woods Francis D and Woods Mary D
Home Financials for this Owner
Home Financials are based on the most recent Mortgage that was taken out on this home.
Original Mortgage
$308,000
Interest Rate
4.82%
Mortgage Type
New Conventional
Purchase Details
Closed on
Dec 23, 1999
Sold by
Robinson Earl C
Bought by
Woods Francis D and Woods Mary D
Create a Home Valuation Report for This Property
The Home Valuation Report is an in-depth analysis detailing your home's value as well as a comparison with similar homes in the area
Home Values in the Area
Average Home Value in this Area
Purchase History
| Date | Buyer | Sale Price | Title Company |
|---|---|---|---|
| Woods Francis D | -- | Rosenberg Lpa | |
| Woods Rachelle Marie | -- | Homeland Title & Escrow Ltd | |
| Woods Francis D | -- | Homeland Title & Escrow Ltd | |
| Woods Francis D | $215,000 | -- |
Source: Public Records
Mortgage History
| Date | Status | Borrower | Loan Amount |
|---|---|---|---|
| Previous Owner | Woods Francis D | $414,000 | |
| Previous Owner | Woods Francis D | $308,000 |
Source: Public Records
Tax History Compared to Growth
Tax History
| Year | Tax Paid | Tax Assessment Tax Assessment Total Assessment is a certain percentage of the fair market value that is determined by local assessors to be the total taxable value of land and additions on the property. | Land | Improvement |
|---|---|---|---|---|
| 2025 | $4,286 | $560,533 | -- | -- |
| 2024 | $4,286 | $518,400 | $300,800 | $217,600 |
| 2023 | $4,164 | $498,700 | $0 | $0 |
| 2022 | $3,879 | $479,000 | $0 | $0 |
| 2021 | $7,592 | $459,300 | $250,800 | $208,500 |
| 2020 | $3,701 | $459,300 | $250,800 | $208,500 |
| 2019 | $3,650 | $459,300 | $250,800 | $208,500 |
| 2018 | $4,906 | $483,800 | $278,300 | $205,500 |
| 2017 | $3,459 | $445,867 | $0 | $0 |
| 2016 | -- | $407,933 | $0 | $0 |
| 2015 | -- | $370,000 | $0 | $0 |
| 2014 | -- | $370,000 | $0 | $0 |
Source: Public Records
Map
Nearby Homes
- 439A Lakeland Rd N
- 518 Lakeland Rd S
- 616 Lakeland Rd S
- 1304 North Rd
- 601 Lakeland Rd S
- 521 Kenmore Rd
- 526 West Dr
- 467 Cornwall Ct
- 500 Kegworth Ct
- 600 Hidden Pond Ln
- 1158 Blue Bird Ln
- 250 Gough Ct
- 610 Echo Cove Dr
- 147 Idlewilde Rd
- 680 Shore Rd
- 717 Whitneys Landing Dr
- 1112 Oak View Dr
- 1123 Oak View Dr
- 130 Clarence Ave
- 1155 Claire Rd
- 3 Saint Andrews Crossover
- 450 Lakeland Rd N
- 448 Lakeland Rd N
- 4 Saint Andrews Crossover
- 446 Lakeland Rd N
- 500 Lakeland Rd S
- 5 Saint Andrews Crossover
- 644 Benfield Rd
- 444 Lakeland Rd N
- 443 Lakeland Rd N
- 502 Lakeland Rd S
- 6 Saint Andrews Crossover
- 7 Saint Andrews Crossover
- 441 Lakeland Rd N
- 642 Benfield Rd
- 440 Bishops Terrace
- 501 Pinefield Dr
- 505 Lakeland Rd S
- 438 Bishops Terrace
- 658 Benfield Rd