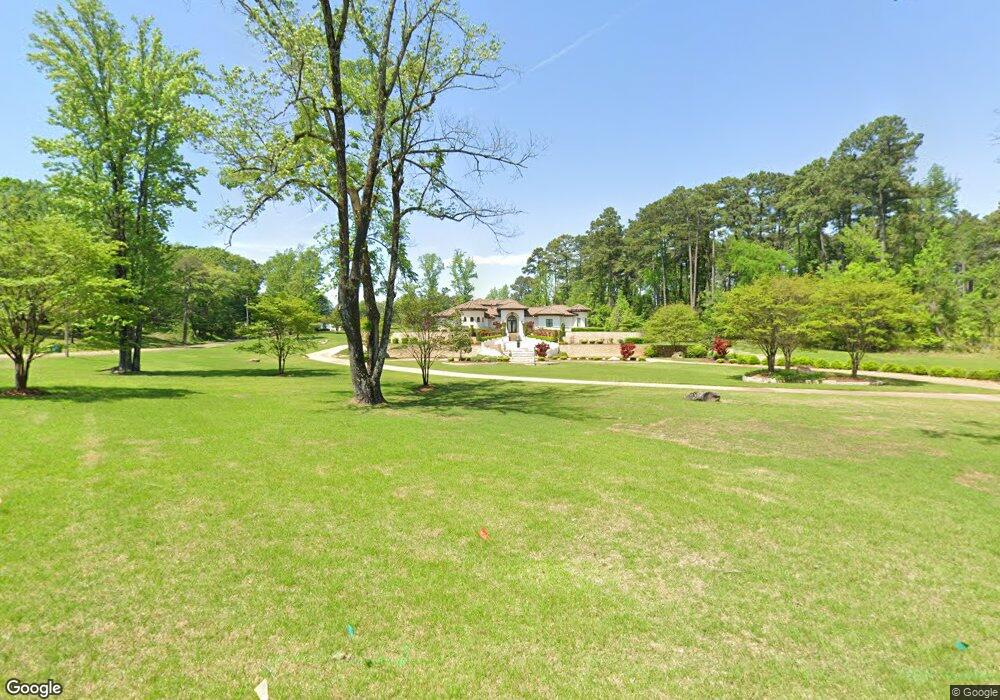
1 Shilling Place Texarkana, TX 75503
Estimated Value: $703,000 - $1,060,749
--
Bed
--
Bath
5,960
Sq Ft
$145/Sq Ft
Est. Value
About This Home
This home is located at 1 Shilling Place, Texarkana, TX 75503 and is currently estimated at $863,583, approximately $144 per square foot. 1 Shilling Place is a home located in Bowie County with nearby schools including Margaret Fischer Davis Elementary School, Pleasant Grove Intermediate School, and Pleasant Grove Middle School.
Ownership History
Date
Name
Owned For
Owner Type
Purchase Details
Closed on
Sep 10, 2010
Sold by
Price Demie Milayne Raffaelli
Bought by
Hicks Tommy and Hicks Jana
Current Estimated Value
Purchase Details
Closed on
Jul 20, 2007
Sold by
Cox Billy W and Cox Lisa L
Bought by
Price Patricia T
Home Financials for this Owner
Home Financials are based on the most recent Mortgage that was taken out on this home.
Original Mortgage
$228,000
Interest Rate
6.54%
Mortgage Type
New Conventional
Purchase Details
Closed on
Jan 27, 2005
Sold by
Northam Jon and Northam Wanda
Bought by
Cox Billy W and Cox Lisa L
Home Financials for this Owner
Home Financials are based on the most recent Mortgage that was taken out on this home.
Original Mortgage
$183,200
Interest Rate
5.85%
Mortgage Type
New Conventional
Create a Home Valuation Report for This Property
The Home Valuation Report is an in-depth analysis detailing your home's value as well as a comparison with similar homes in the area
Home Values in the Area
Average Home Value in this Area
Purchase History
| Date | Buyer | Sale Price | Title Company |
|---|---|---|---|
| Hicks Tommy | -- | Stewart Title Of Texarkana | |
| Price Demie Milayne Raffaelli | -- | Stewart Title Of Texarkana | |
| Price Patricia T | -- | Twin City Title Co | |
| Cox Billy W | -- | None Available |
Source: Public Records
Mortgage History
| Date | Status | Borrower | Loan Amount |
|---|---|---|---|
| Previous Owner | Price Patricia T | $228,000 | |
| Previous Owner | Cox Billy W | $183,200 |
Source: Public Records
Tax History Compared to Growth
Tax History
| Year | Tax Paid | Tax Assessment Tax Assessment Total Assessment is a certain percentage of the fair market value that is determined by local assessors to be the total taxable value of land and additions on the property. | Land | Improvement |
|---|---|---|---|---|
| 2025 | $25,233 | $1,210,610 | $49,491 | $1,161,119 |
| 2024 | $25,233 | $1,225,682 | $49,491 | $1,176,191 |
| 2023 | $27,975 | $1,242,634 | $42,300 | $1,200,334 |
| 2022 | $29,975 | $1,220,756 | $42,300 | $1,178,456 |
| 2021 | $29,243 | $1,118,198 | $42,300 | $1,075,898 |
| 2020 | $31,919 | $1,214,151 | $35,955 | $1,178,196 |
| 2019 | $31,341 | $1,161,865 | $35,955 | $1,125,910 |
| 2018 | $31,166 | $1,161,865 | $35,955 | $1,125,910 |
| 2017 | $31,255 | $1,168,377 | $35,955 | $1,132,422 |
| 2016 | $30,436 | $1,137,771 | $35,955 | $1,101,816 |
| 2015 | $16,995 | $1,127,753 | $35,955 | $1,091,798 |
| 2014 | $16,995 | $632,203 | $35,955 | $596,248 |
Source: Public Records
Map
Nearby Homes
- 6 High Point Dr
- 7311 Shilling Cir
- 7309 Shilling Cir
- 0 Shilling Rd Unit 118529
- 7202 Shilling Cir
- 7208 Shadow Brooke
- 23 Holly Ridge Dr
- 3810 Hunters Ridge
- 3809 Hunters Ridge
- 918 Clear Creek Dr
- 26 Summer Ln
- 16 Dogwood Place
- 4 Holly Ridge Dr
- 8 Wild Oak Cir
- 11 Dogwood Place
- 7 Brittan Place
- 13 Brittan Place
- 6301 Pecan Cove
- 604 Clear Creek Dr
- 26 Brittan Place
- 7 Shilling Place
- 0 Shilling Place
- 3205 Shilling Rd
- 0 Overlock Ln
- 3115 Shilling Rd
- 1 Chartwell
- 119 Overlock Ln
- 6 Shilling Place
- 3250 Shilling Rd
- 3109 Shilling Rd
- 2 Shilling Place
- 120 Overlock Ln
- 5 Chartwell
- 7312 Shilling Cir
- 2 High Point Dr
- 7310 Shilling Cir
- 7450 Stone Creek Dr
- 7308 Shilling Cir
- 5 Shilling Place
- 2 Chartwell