1 Shira Ln Manalapan, NJ 07726
Estimated Value: $1,201,000 - $1,347,000
4
Beds
2
Baths
3,093
Sq Ft
$405/Sq Ft
Est. Value
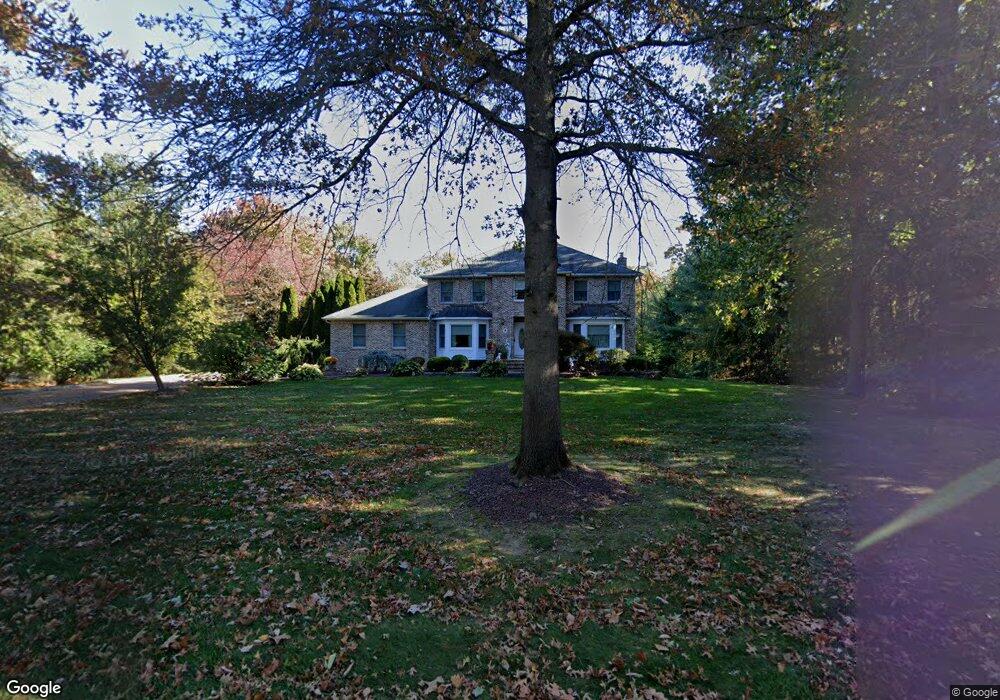
About This Home
This home is located at 1 Shira Ln, Manalapan, NJ 07726 and is currently estimated at $1,253,322, approximately $405 per square foot. 1 Shira Ln is a home located in Monmouth County with nearby schools including Wemrock Brook School, Manalapan-Englishtown Middle School, and Pine Brook Elementary School.
Ownership History
Date
Name
Owned For
Owner Type
Purchase Details
Closed on
Nov 16, 2001
Sold by
Goldstein Michael
Bought by
Vitali John and Vitali Michele
Current Estimated Value
Home Financials for this Owner
Home Financials are based on the most recent Mortgage that was taken out on this home.
Original Mortgage
$275,000
Interest Rate
7.18%
Purchase Details
Closed on
Aug 11, 1995
Sold by
Elton Point Inc
Bought by
Goldstein Michael and Goldstein Rita
Home Financials for this Owner
Home Financials are based on the most recent Mortgage that was taken out on this home.
Original Mortgage
$200,000
Interest Rate
7.61%
Create a Home Valuation Report for This Property
The Home Valuation Report is an in-depth analysis detailing your home's value as well as a comparison with similar homes in the area
Home Values in the Area
Average Home Value in this Area
Purchase History
| Date | Buyer | Sale Price | Title Company |
|---|---|---|---|
| Vitali John | $525,000 | -- | |
| Goldstein Michael | $310,000 | -- |
Source: Public Records
Mortgage History
| Date | Status | Borrower | Loan Amount |
|---|---|---|---|
| Previous Owner | Vitali John | $275,000 | |
| Previous Owner | Goldstein Michael | $200,000 |
Source: Public Records
Tax History Compared to Growth
Tax History
| Year | Tax Paid | Tax Assessment Tax Assessment Total Assessment is a certain percentage of the fair market value that is determined by local assessors to be the total taxable value of land and additions on the property. | Land | Improvement |
|---|---|---|---|---|
| 2025 | $16,770 | $1,105,800 | $384,000 | $721,800 |
| 2024 | $16,286 | $993,500 | $384,000 | $609,500 |
| 2023 | $16,286 | $979,300 | $384,000 | $595,300 |
| 2022 | $14,293 | $811,900 | $279,000 | $532,900 |
| 2021 | $14,293 | $686,500 | $212,500 | $474,000 |
| 2020 | $13,915 | $675,500 | $167,500 | $508,000 |
| 2019 | $14,730 | $714,000 | $217,500 | $496,500 |
| 2018 | $13,019 | $627,100 | $167,500 | $459,600 |
| 2017 | $12,747 | $614,300 | $167,500 | $446,800 |
| 2016 | $12,737 | $620,100 | $179,000 | $441,100 |
| 2015 | $12,637 | $608,700 | $179,000 | $429,700 |
| 2014 | $12,810 | $601,400 | $203,500 | $397,900 |
Source: Public Records
Map
Nearby Homes