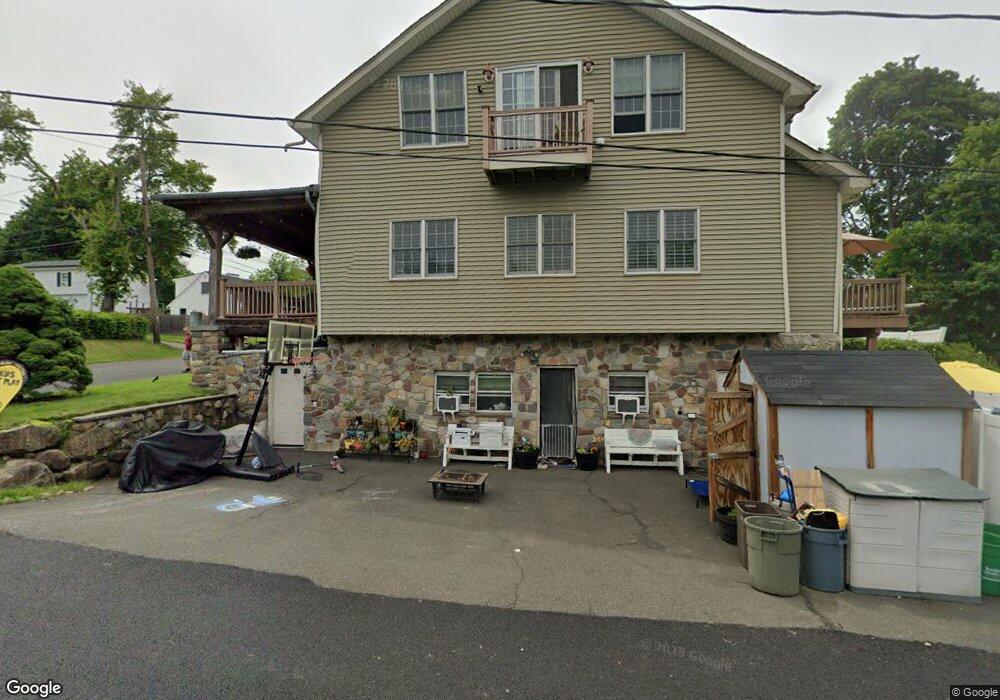
1 Spring St Stony Point, NY 10980
Estimated Value: $503,510 - $600,000
3
Beds
2
Baths
2,048
Sq Ft
$267/Sq Ft
Est. Value
About This Home
This home is located at 1 Spring St, Stony Point, NY 10980 and is currently estimated at $547,378, approximately $267 per square foot. 1 Spring St is a home located in Rockland County with nearby schools including James A. Farley Middle School, Stony Point Elementary School, and Fieldstone Secondary School.
Ownership History
Date
Name
Owned For
Owner Type
Purchase Details
Closed on
Dec 14, 2018
Sold by
Deirdre Kossmann Brian and Reilly Deirdre O
Bought by
Kossmann Brian
Current Estimated Value
Purchase Details
Closed on
May 7, 1999
Sold by
Sparta Tindaro and Sparta Joseph
Bought by
Kossman Brian
Home Financials for this Owner
Home Financials are based on the most recent Mortgage that was taken out on this home.
Original Mortgage
$108,000
Outstanding Balance
$27,628
Interest Rate
6.92%
Estimated Equity
$519,750
Create a Home Valuation Report for This Property
The Home Valuation Report is an in-depth analysis detailing your home's value as well as a comparison with similar homes in the area
Home Values in the Area
Average Home Value in this Area
Purchase History
| Date | Buyer | Sale Price | Title Company |
|---|---|---|---|
| Kossmann Brian | -- | None Available | |
| Kossman Brian | $120,000 | -- |
Source: Public Records
Mortgage History
| Date | Status | Borrower | Loan Amount |
|---|---|---|---|
| Open | Kossman Brian | $108,000 |
Source: Public Records
Tax History
| Year | Tax Paid | Tax Assessment Tax Assessment Total Assessment is a certain percentage of the fair market value that is determined by local assessors to be the total taxable value of land and additions on the property. | Land | Improvement |
|---|---|---|---|---|
| 2024 | $11,539 | $30,500 | $3,500 | $27,000 |
| 2023 | $11,539 | $30,500 | $3,500 | $27,000 |
| 2022 | $2,802 | $30,500 | $3,500 | $27,000 |
| 2021 | $2,802 | $30,500 | $3,500 | $27,000 |
| 2020 | $7,548 | $30,500 | $3,500 | $27,000 |
| 2019 | $2,989 | $30,500 | $3,500 | $27,000 |
| 2018 | $7,128 | $30,500 | $3,500 | $27,000 |
| 2017 | $6,930 | $30,500 | $3,500 | $27,000 |
| 2016 | $7,149 | $30,500 | $3,500 | $27,000 |
| 2015 | -- | $30,500 | $3,500 | $27,000 |
| 2014 | -- | $30,500 | $3,500 | $27,000 |
Source: Public Records
Map
Nearby Homes
Your Personal Tour Guide
Ask me questions while you tour the home.