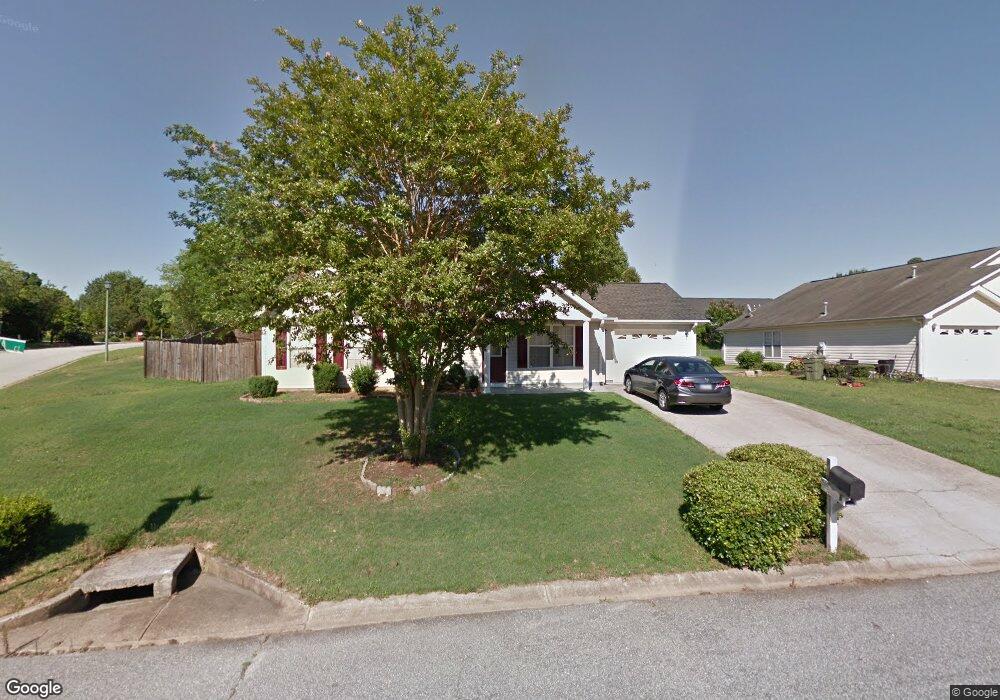
1 Spring Vista Ct Fountain Inn, SC 29644
Estimated Value: $227,447 - $267,000
3
Beds
2
Baths
1,150
Sq Ft
$214/Sq Ft
Est. Value
About This Home
This home is located at 1 Spring Vista Ct, Fountain Inn, SC 29644 and is currently estimated at $246,612, approximately $214 per square foot. 1 Spring Vista Ct is a home located in Greenville County with nearby schools including Bryson Elementary School, Bryson Middle School, and Fountain Inn Christian School.
Ownership History
Date
Name
Owned For
Owner Type
Purchase Details
Closed on
Dec 9, 2016
Sold by
Restrepo Diego J and Caceres Yaneth
Bought by
Rosa Medina Jiomar and Cabral Diaz Vanessa
Current Estimated Value
Home Financials for this Owner
Home Financials are based on the most recent Mortgage that was taken out on this home.
Original Mortgage
$130,853
Outstanding Balance
$105,498
Interest Rate
3.47%
Mortgage Type
New Conventional
Estimated Equity
$141,114
Purchase Details
Closed on
May 15, 2007
Sold by
Restrepo Diego J
Bought by
Restrepo Diego J and Caceres Yaneth
Home Financials for this Owner
Home Financials are based on the most recent Mortgage that was taken out on this home.
Original Mortgage
$94,090
Interest Rate
6.12%
Mortgage Type
Purchase Money Mortgage
Purchase Details
Closed on
Jun 29, 1999
Sold by
Seppala Homes Inc
Bought by
Cook Mary E
Create a Home Valuation Report for This Property
The Home Valuation Report is an in-depth analysis detailing your home's value as well as a comparison with similar homes in the area
Home Values in the Area
Average Home Value in this Area
Purchase History
| Date | Buyer | Sale Price | Title Company |
|---|---|---|---|
| Rosa Medina Jiomar | $134,900 | None Available | |
| Restrepo Diego J | -- | None Available | |
| Restrepo Diego J | $97,000 | None Available | |
| Cook Mary E | $85,580 | -- |
Source: Public Records
Mortgage History
| Date | Status | Borrower | Loan Amount |
|---|---|---|---|
| Open | Rosa Medina Jiomar | $130,853 | |
| Previous Owner | Restrepo Diego J | $94,090 |
Source: Public Records
Tax History Compared to Growth
Tax History
| Year | Tax Paid | Tax Assessment Tax Assessment Total Assessment is a certain percentage of the fair market value that is determined by local assessors to be the total taxable value of land and additions on the property. | Land | Improvement |
|---|---|---|---|---|
| 2024 | $1,201 | $5,360 | $880 | $4,480 |
| 2023 | $1,201 | $5,360 | $880 | $4,480 |
| 2022 | $1,176 | $5,360 | $880 | $4,480 |
| 2021 | $1,165 | $5,360 | $880 | $4,480 |
| 2020 | $1,217 | $5,210 | $720 | $4,490 |
| 2019 | $1,218 | $5,210 | $720 | $4,490 |
| 2018 | $1,216 | $5,210 | $720 | $4,490 |
| 2017 | $1,086 | $5,210 | $720 | $4,490 |
| 2016 | $783 | $95,710 | $18,000 | $77,710 |
| 2015 | $783 | $95,710 | $18,000 | $77,710 |
| 2014 | $773 | $96,640 | $18,000 | $78,640 |
Source: Public Records
Map
Nearby Homes
- 106 Watauga Rd
- Cameron Plan at Blue Ridge Trail
- Oakland B Plan at Blue Ridge Trail
- Astoria (Revised) Plan at Blue Ridge Trail
- Atwood Plan at Blue Ridge Trail
- Crestone Plan at Blue Ridge Trail
- Vail Plan at Blue Ridge Trail
- Phoenix Plan at Blue Ridge Trail
- Huntington Plan at Blue Ridge Trail
- Gibson Plan at Blue Ridge Trail
- Anthony B Plan at Blue Ridge Trail
- Keystone Plan at Blue Ridge Trail
- 19 Kendals Ln
- 109 Blue Ridge Dr
- 102 Sagewood Ct
- 628 Hellams St
- 119A Woodland Dr
- 118 Sylvester St
- 513 Scarlet Oak Dr
- 416 Scarlet Oak Dr
- 3 Spring Vista Ct
- 702 Veryfine Dr
- 800 Veryfine Dr
- 703 Very Fine Dr
- 630 Veryfine Dr
- 703 Veryfine Dr
- 5 Spring Vista Ct
- 701 Veryfine Dr
- 802 Veryfine Dr
- 705 Veryfine Dr
- 639 Veryfine Dr
- 707 Veryfine Dr
- 4 Spring Vista Ct
- 7 Spring Vista Ct
- 804 Veryfine Dr
- 628 Veryfine Dr
- 637 Veryfine Dr
- 1 Glimmering Place
- 6 Spring Vista Ct
- 805 Veryfine Dr