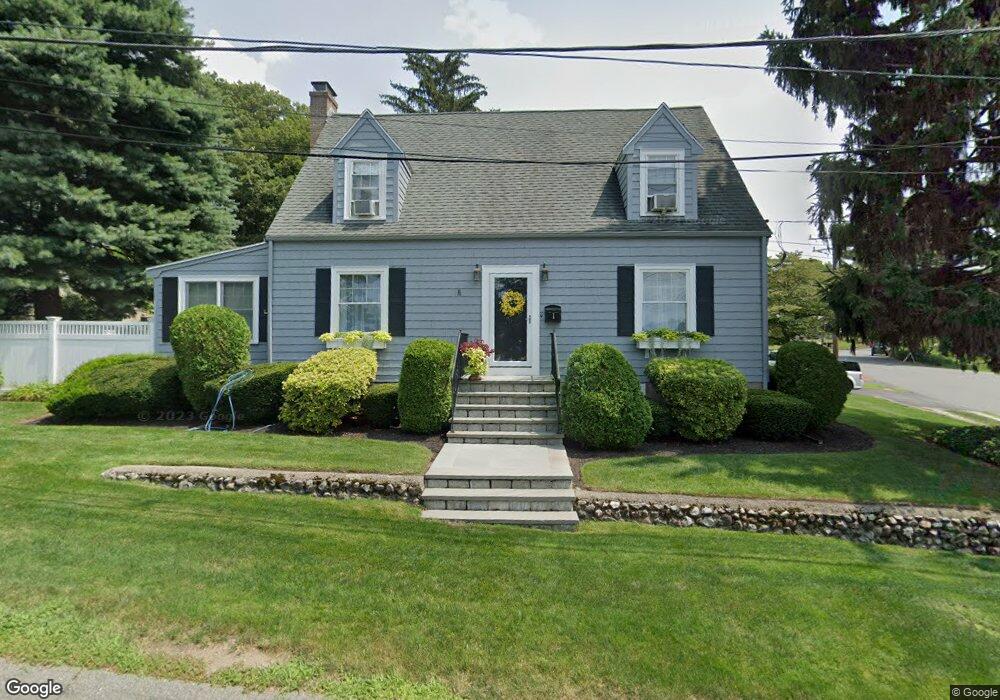
1 Steele St Stoneham, MA 02180
Bear Hill NeighborhoodEstimated Value: $883,000 - $961,000
3
Beds
2
Baths
2,287
Sq Ft
$404/Sq Ft
Est. Value
About This Home
This home is located at 1 Steele St, Stoneham, MA 02180 and is currently estimated at $925,029, approximately $404 per square foot. 1 Steele St is a home located in Middlesex County with nearby schools including Stoneham High School, St. Patrick Elementary School, and St Joseph School.
Ownership History
Date
Name
Owned For
Owner Type
Purchase Details
Closed on
Apr 17, 2020
Sold by
Mcgovern Rt
Bought by
Julie A Mcgovern Ret
Current Estimated Value
Purchase Details
Closed on
Aug 16, 2012
Sold by
Mcgovern James E and Mcgovern Julie A
Bought by
Mcgovern Rt and Mcgovern James E
Purchase Details
Closed on
Sep 21, 2011
Sold by
Mcgovern Rt and Mcgovern James E
Bought by
Mcgovern James E and Mcgovern Julie A
Home Financials for this Owner
Home Financials are based on the most recent Mortgage that was taken out on this home.
Original Mortgage
$135,000
Interest Rate
4.33%
Mortgage Type
Purchase Money Mortgage
Purchase Details
Closed on
Mar 17, 2006
Sold by
Mcgovern James E and Mcgovern Julie A
Bought by
Mcgovern Tr James E and Mcgovern Julie A
Create a Home Valuation Report for This Property
The Home Valuation Report is an in-depth analysis detailing your home's value as well as a comparison with similar homes in the area
Home Values in the Area
Average Home Value in this Area
Purchase History
| Date | Buyer | Sale Price | Title Company |
|---|---|---|---|
| Julie A Mcgovern Ret | -- | None Available | |
| Mcgovern Rt | -- | -- | |
| Mcgovern James E | -- | -- | |
| Mcgovern Tr James E | -- | -- |
Source: Public Records
Mortgage History
| Date | Status | Borrower | Loan Amount |
|---|---|---|---|
| Previous Owner | Mcgovern James E | $135,000 | |
| Previous Owner | Mcgovern James E | $50,000 |
Source: Public Records
Tax History
| Year | Tax Paid | Tax Assessment Tax Assessment Total Assessment is a certain percentage of the fair market value that is determined by local assessors to be the total taxable value of land and additions on the property. | Land | Improvement |
|---|---|---|---|---|
| 2025 | $8,699 | $850,300 | $402,700 | $447,600 |
| 2024 | $8,436 | $796,600 | $383,600 | $413,000 |
| 2023 | $8,162 | $735,300 | $345,200 | $390,100 |
| 2022 | $7,237 | $695,200 | $326,000 | $369,200 |
| 2021 | $7,232 | $668,400 | $306,800 | $361,600 |
| 2020 | $6,983 | $647,200 | $294,700 | $352,500 |
| 2019 | $6,845 | $610,100 | $280,500 | $329,600 |
| 2018 | $6,826 | $582,900 | $256,700 | $326,200 |
| 2017 | $6,570 | $530,300 | $242,900 | $287,400 |
| 2016 | $6,246 | $491,800 | $224,200 | $267,600 |
| 2015 | $6,013 | $464,000 | $224,200 | $239,800 |
| 2014 | $5,807 | $430,500 | $214,900 | $215,600 |
Source: Public Records
Map
Nearby Homes
- 8 Steele St
- 159 Main St Unit 27C
- 159 Main St Unit 39A
- 62 High St Unit Lot 8
- 62 High St Unit 4
- 62 High St Unit Lot 5
- 62 High St Unit Lot 12
- 98 Main St Unit 2
- 1 Tremont St
- 21 Tremont St Unit B
- 21 Tremont St Unit A
- 58 Washington St
- 66 Main St Unit 15A
- 35 Tremont St
- 12 Isola Ln
- 68 Main St Unit 21C
- 64 Main St Unit 24B
- 4 Garfield Ave
- 1 Alden Ave
- 10 Pomeworth St Unit A
- 157 Collincote St
- 3 Steele St
- 2 Steele St
- 164 Collincote St
- 7 Steele St
- 62 Endicott Rd
- 11 Cowdrey St
- 6 Steele St
- 6 Steele St
- 171 Collincote St
- 168 Collincote St
- 170 Collincote St
- 9 Cowdrey St
- 54 Endicott Rd
- 152 Collincote St
- 12 Cowdrey St
- 172 Collincote St
- 50 Endicott Rd
- LOT C Steele St
- 7 Cowdrey St
Your Personal Tour Guide
Ask me questions while you tour the home.