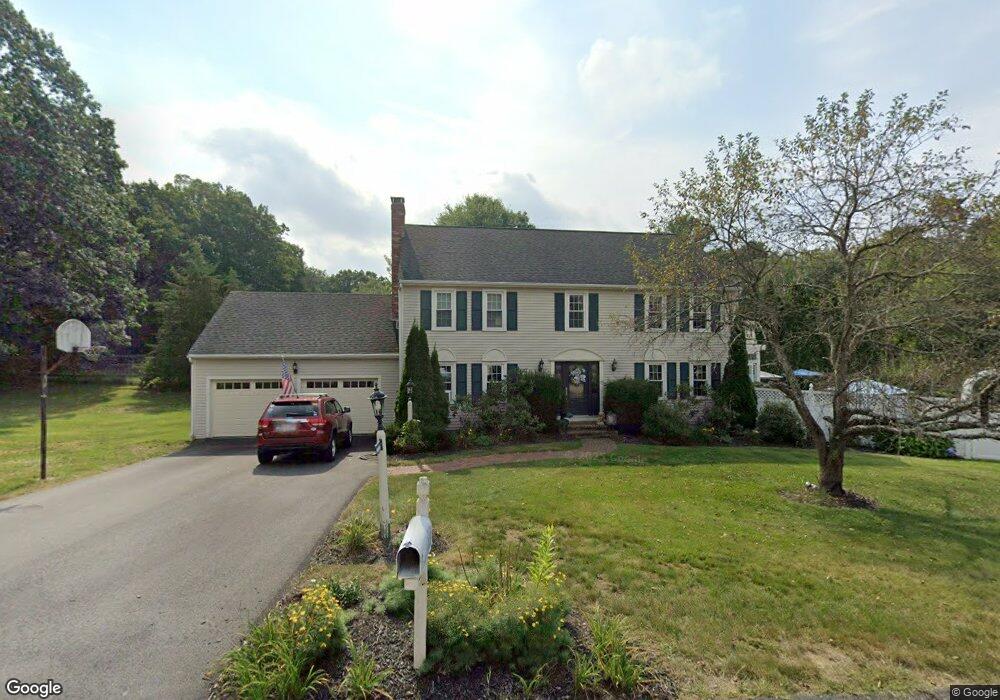
1 Stone End Rd Medway, MA 02053
Estimated Value: $749,000 - $898,000
4
Beds
3
Baths
2,546
Sq Ft
$321/Sq Ft
Est. Value
About This Home
This home is located at 1 Stone End Rd, Medway, MA 02053 and is currently estimated at $816,383, approximately $320 per square foot. 1 Stone End Rd is a home located in Norfolk County with nearby schools including John D. McGovern Elementary School, Burke-Memorial Elementary, and Medway Middle School.
Ownership History
Date
Name
Owned For
Owner Type
Purchase Details
Closed on
Mar 16, 2021
Sold by
Macpherson Douglas G and Macpherson Sharon A
Bought by
Macpherson Ft and Macpherson
Current Estimated Value
Purchase Details
Closed on
Dec 15, 2020
Sold by
Macpherson Ft and Macpherson
Bought by
Macpherson Douglas G and Macpherson Sharon A
Home Financials for this Owner
Home Financials are based on the most recent Mortgage that was taken out on this home.
Original Mortgage
$357,000
Interest Rate
2.7%
Mortgage Type
New Conventional
Purchase Details
Closed on
Nov 21, 2013
Sold by
Macpherson Douglas G and Macpherson Sharon A
Bought by
Macpherson Ft and Macpherson
Purchase Details
Closed on
Jun 5, 1986
Bought by
Macpherson Ft
Create a Home Valuation Report for This Property
The Home Valuation Report is an in-depth analysis detailing your home's value as well as a comparison with similar homes in the area
Home Values in the Area
Average Home Value in this Area
Purchase History
| Date | Buyer | Sale Price | Title Company |
|---|---|---|---|
| Macpherson Ft | -- | None Available | |
| Macpherson Douglas G | -- | None Available | |
| Macpherson Ft | -- | -- | |
| Macpherson Ft | -- | -- | |
| Macpherson Ft | $233,900 | -- |
Source: Public Records
Mortgage History
| Date | Status | Borrower | Loan Amount |
|---|---|---|---|
| Previous Owner | Macpherson Douglas G | $357,000 | |
| Previous Owner | Macpherson Ft | $322,700 |
Source: Public Records
Tax History
| Year | Tax Paid | Tax Assessment Tax Assessment Total Assessment is a certain percentage of the fair market value that is determined by local assessors to be the total taxable value of land and additions on the property. | Land | Improvement |
|---|---|---|---|---|
| 2025 | $10,574 | $742,000 | $346,700 | $395,300 |
| 2024 | $10,685 | $742,000 | $346,700 | $395,300 |
| 2023 | $10,637 | $667,300 | $316,200 | $351,100 |
| 2022 | $9,584 | $566,100 | $235,600 | $330,500 |
| 2021 | $8,927 | $511,300 | $220,300 | $291,000 |
| 2020 | $8,757 | $500,400 | $220,300 | $280,100 |
| 2019 | $8,283 | $488,100 | $211,600 | $276,500 |
| 2018 | $8,350 | $472,800 | $202,900 | $269,900 |
| 2017 | $8,318 | $464,200 | $198,600 | $265,600 |
| 2016 | $8,130 | $448,900 | $183,300 | $265,600 |
| 2015 | $8,026 | $440,000 | $181,100 | $258,900 |
| 2014 | $8,165 | $433,400 | $188,000 | $245,400 |
Source: Public Records
Map
Nearby Homes
- 23 Cedar Farms Rd
- 8 Liberty Rd
- 56 Fisher St
- 3 Nobscott Rd
- 15 Fox Run Rd
- 22 Granite St
- LOT 8 Pond View
- 190-194 E Main St
- 6 Kingson Ln Unit 2
- 45 Wendy Ln
- 2 Kingson Ln Unit 2
- 4 Waterfall Ln
- 4 Bullard Cir
- 3 Thayer Rd
- 6 Freedom Trail
- 50 Morgans Way
- 462 Hartford Ave
- 35 Woodland Ave Unit 35A
- 15 Black Bear Cir Unit 15
- 13 Black Bear Cir Unit 13
Your Personal Tour Guide
Ask me questions while you tour the home.