Estimated Value: $130,000 - $311,143
7
Beds
4
Baths
5,128
Sq Ft
$39/Sq Ft
Est. Value
About This Home
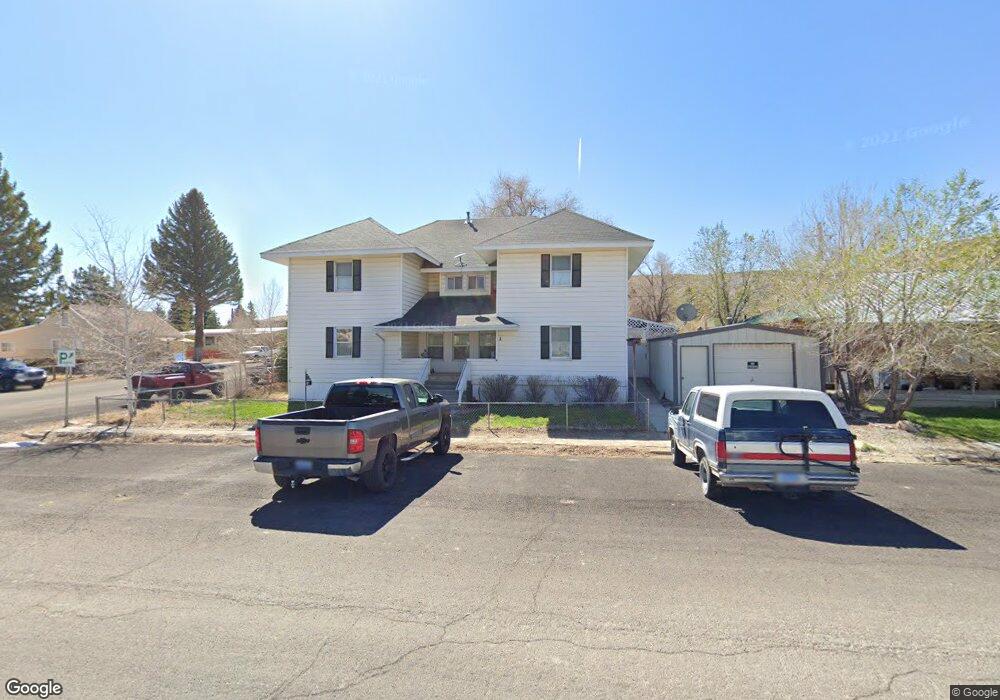
This home is located at 1 Sunshine St, Ruth, NV 89319 and is currently estimated at $200,786, approximately $39 per square foot. 1 Sunshine St is a home located in White Pine County with nearby schools including David E. Norman Elementary School, White Pine Middle School, and White Pine High School.
Ownership History
Date
Name
Owned For
Owner Type
Purchase Details
Closed on
Nov 2, 2018
Sold by
Us Bank Na
Bought by
Poulsen Theresa M and Collette Jackie M
Current Estimated Value
Purchase Details
Closed on
Jul 24, 2017
Sold by
Perfect John R and Perfect Valeria A
Bought by
U S Bank National Association
Purchase Details
Closed on
Apr 22, 2014
Sold by
Elsie L Elsie L
Bought by
Perfect John R and Perfect Valerie A
Home Financials for this Owner
Home Financials are based on the most recent Mortgage that was taken out on this home.
Original Mortgage
$156,122
Interest Rate
4.28%
Mortgage Type
New Conventional
Purchase Details
Closed on
Sep 10, 2012
Sold by
Baker Sam P and Baker Barbara
Bought by
Chrisley Elsie L
Home Financials for this Owner
Home Financials are based on the most recent Mortgage that was taken out on this home.
Original Mortgage
$149,246
Interest Rate
3.34%
Mortgage Type
FHA
Create a Home Valuation Report for This Property
The Home Valuation Report is an in-depth analysis detailing your home's value as well as a comparison with similar homes in the area
Purchase History
| Date | Buyer | Sale Price | Title Company |
|---|---|---|---|
| Poulsen Theresa M | $50,500 | Title365 Newport | |
| U S Bank National Association | $111,600 | Title 365 Company | |
| Perfect John R | $153,000 | Stewart Title Company | |
| Chrisley Elsie L | $152,000 | Stewart Title Company |
Source: Public Records
Mortgage History
| Date | Status | Borrower | Loan Amount |
|---|---|---|---|
| Previous Owner | Perfect John R | $156,122 | |
| Previous Owner | Chrisley Elsie L | $149,246 |
Source: Public Records
Tax History
| Year | Tax Paid | Tax Assessment Tax Assessment Total Assessment is a certain percentage of the fair market value that is determined by local assessors to be the total taxable value of land and additions on the property. | Land | Improvement |
|---|---|---|---|---|
| 2025 | $1,676 | $53,923 | $2,127 | $51,796 |
| 2024 | $1,676 | $51,644 | $1,784 | $49,860 |
| 2023 | $1,676 | $46,789 | $1,784 | $45,005 |
| 2022 | $1,510 | $41,365 | $1,784 | $39,581 |
| 2021 | $1,401 | $39,090 | $1,738 | $37,352 |
| 2020 | $1,330 | $40,152 | $1,738 | $38,414 |
| 2019 | $1,292 | $37,819 | $1,738 | $36,081 |
| 2018 | $1,255 | $37,356 | $1,738 | $35,618 |
| 2017 | $1,214 | $36,164 | $1,738 | $34,426 |
| 2016 | $1,179 | $32,678 | $1,761 | $30,917 |
| 2015 | $952 | $32,509 | $1,898 | $30,611 |
| 2014 | $952 | $31,566 | $1,555 | $30,011 |
Source: Public Records
Map
Nearby Homes
Your Personal Tour Guide
Ask me questions while you tour the home.