Estimated Value: $89,000 - $184,000
2
Beds
1
Bath
896
Sq Ft
$152/Sq Ft
Est. Value
About This Home
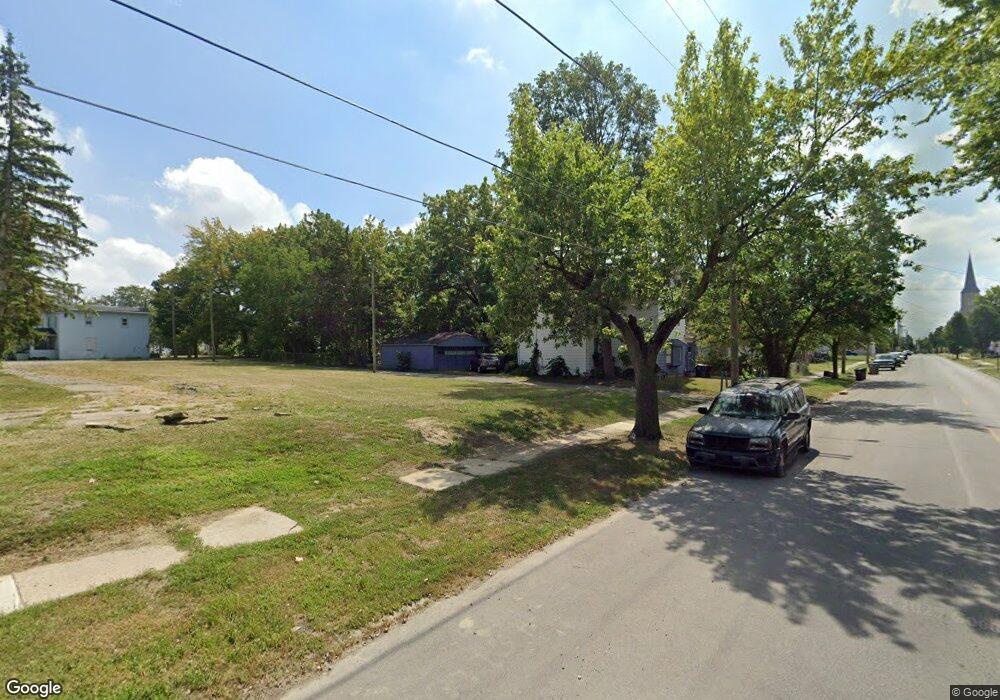
This home is located at 1 Superior Ct, Lima, OH 45801 and is currently estimated at $136,500, approximately $152 per square foot. 1 Superior Ct is a home located in Allen County with nearby schools including Independence Elementary School, Lima North Middle School, and Lima West Middle School.
Ownership History
Date
Name
Owned For
Owner Type
Purchase Details
Closed on
Apr 24, 2018
Sold by
George Richard A
Bought by
Abr Investment Properties Llc
Current Estimated Value
Home Financials for this Owner
Home Financials are based on the most recent Mortgage that was taken out on this home.
Original Mortgage
$149,500
Outstanding Balance
$128,627
Interest Rate
4.46%
Mortgage Type
Seller Take Back
Estimated Equity
$7,873
Purchase Details
Closed on
Mar 29, 2018
Sold by
George Richard A
Bought by
Richard A George And Rosella C George Re
Home Financials for this Owner
Home Financials are based on the most recent Mortgage that was taken out on this home.
Original Mortgage
$149,500
Outstanding Balance
$128,627
Interest Rate
4.46%
Mortgage Type
Seller Take Back
Estimated Equity
$7,873
Purchase Details
Closed on
Jan 1, 1990
Bought by
George Richard A
Create a Home Valuation Report for This Property
The Home Valuation Report is an in-depth analysis detailing your home's value as well as a comparison with similar homes in the area
Purchase History
| Date | Buyer | Sale Price | Title Company |
|---|---|---|---|
| Abr Investment Properties Llc | $150,000 | None Available | |
| Richard A George And Rosella C George Re | -- | None Available | |
| George Richard A | -- | -- |
Source: Public Records
Mortgage History
| Date | Status | Borrower | Loan Amount |
|---|---|---|---|
| Open | Abr Investment Properties Llc | $149,500 |
Source: Public Records
Tax History
| Year | Tax Paid | Tax Assessment Tax Assessment Total Assessment is a certain percentage of the fair market value that is determined by local assessors to be the total taxable value of land and additions on the property. | Land | Improvement |
|---|---|---|---|---|
| 2024 | $412 | $530 | $530 | -- |
| 2023 | $516 | $3,120 | $420 | $2,700 |
| 2022 | $489 | $3,120 | $420 | $2,700 |
| 2021 | $512 | $3,120 | $420 | $2,700 |
| 2020 | $356 | $6,020 | $280 | $5,740 |
| 2019 | $356 | $6,020 | $280 | $5,740 |
| 2018 | $353 | $6,020 | $280 | $5,740 |
| 2017 | $357 | $6,020 | $280 | $5,740 |
| 2016 | $363 | $6,020 | $280 | $5,740 |
| 2015 | $306 | $6,020 | $280 | $5,740 |
| 2014 | $306 | $4,830 | $280 | $4,550 |
| 2013 | $350 | $4,830 | $280 | $4,550 |
Source: Public Records
Map
Nearby Homes
- 416 Hazel Ave
- 514 & 516 N Elizabeth St
- 735 N Elizabeth St
- 435 Marian Ave
- 316 Ewing Ave
- 406 Ewing Ave
- 934 N Metcalf St
- 919 N Main St
- 5 Unit Package
- 1021 N McDonel St
- 627 Brice Ave
- 555 Haller St
- 325 N McDonel St
- 431 N Metcalf St
- 816 N Baxter St
- 745 Richie Ave
- 841 N Baxter St
- 735 Brice Ave
- 557 W Ashton Ave
- 576 W Ashton Ave
Your Personal Tour Guide
Ask me questions while you tour the home.