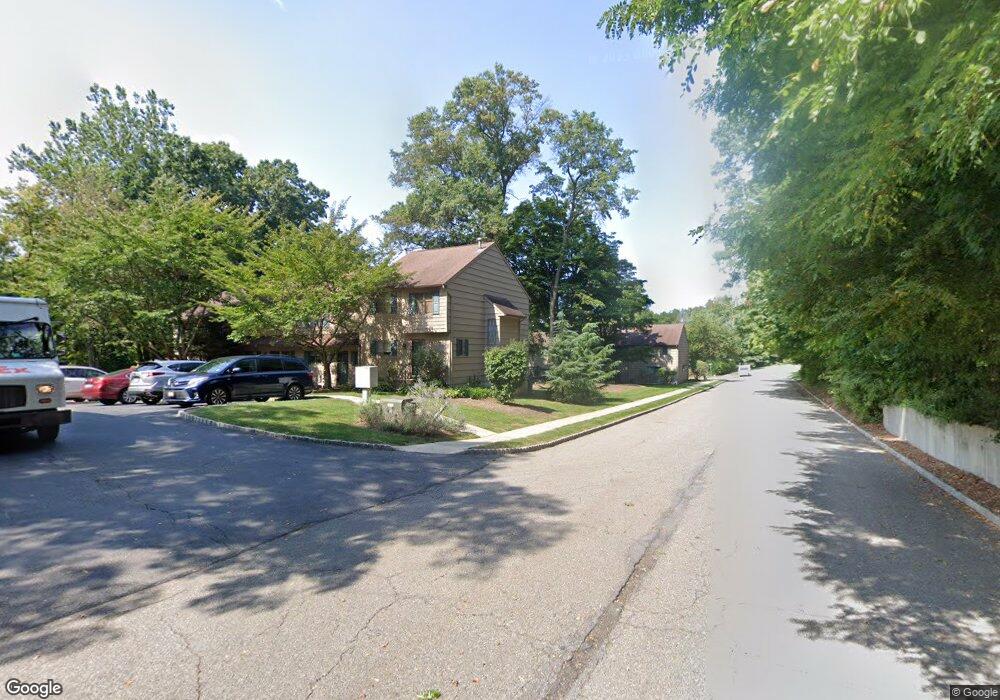
1 Sycamore Ct High Bridge, NJ 08829
Estimated Value: $316,069 - $342,000
--
Bed
--
Bath
1,173
Sq Ft
$282/Sq Ft
Est. Value
About This Home
This home is located at 1 Sycamore Ct, High Bridge, NJ 08829 and is currently estimated at $330,767, approximately $281 per square foot. 1 Sycamore Ct is a home located in Hunterdon County with nearby schools including High Bridge Elementary School, High Bridge Middle School, and Voorhees High School.
Ownership History
Date
Name
Owned For
Owner Type
Purchase Details
Closed on
Oct 30, 1996
Sold by
Maresca David Louis and Maresca Francis George
Bought by
Kochevar Markita A
Current Estimated Value
Home Financials for this Owner
Home Financials are based on the most recent Mortgage that was taken out on this home.
Original Mortgage
$68,000
Outstanding Balance
$6,707
Interest Rate
8.1%
Estimated Equity
$324,060
Create a Home Valuation Report for This Property
The Home Valuation Report is an in-depth analysis detailing your home's value as well as a comparison with similar homes in the area
Home Values in the Area
Average Home Value in this Area
Purchase History
| Date | Buyer | Sale Price | Title Company |
|---|---|---|---|
| Kochevar Markita A | $85,000 | -- |
Source: Public Records
Mortgage History
| Date | Status | Borrower | Loan Amount |
|---|---|---|---|
| Open | Kochevar Markita A | $68,000 |
Source: Public Records
Tax History Compared to Growth
Tax History
| Year | Tax Paid | Tax Assessment Tax Assessment Total Assessment is a certain percentage of the fair market value that is determined by local assessors to be the total taxable value of land and additions on the property. | Land | Improvement |
|---|---|---|---|---|
| 2025 | $7,648 | $222,900 | $116,500 | $106,400 |
| 2024 | $7,362 | $234,300 | $72,100 | $162,200 |
| 2023 | $7,362 | $186,200 | $66,000 | $120,200 |
| 2022 | $6,548 | $153,900 | $56,000 | $97,900 |
| 2021 | $6,287 | $154,500 | $56,000 | $98,500 |
| 2020 | $6,322 | $154,200 | $55,100 | $99,100 |
| 2019 | $6,287 | $152,200 | $52,500 | $99,700 |
| 2018 | $5,956 | $150,300 | $50,000 | $100,300 |
| 2017 | $5,862 | $152,100 | $50,000 | $102,100 |
| 2016 | $5,793 | $152,100 | $50,000 | $102,100 |
| 2015 | $5,637 | $152,100 | $50,000 | $102,100 |
| 2014 | $5,953 | $173,600 | $85,000 | $88,600 |
Source: Public Records
Map
Nearby Homes
- 2 Sycamore Ct
- 3 Sycamore Ct
- 4 Sycamore Ct
- 5 Sycamore Ct
- 7 Sycamore Ct
- 6 Sycamore Ct
- 28 Chestnut Ct
- 15 Indian Spring Ln
- 13 Indian Spring Ln
- 30 Chestnut Ct
- 29 Chestnut Ct
- 27 Chestnut Ct
- 31 Chestnut Ct
- 10 Indian Spring Ln
- 26 Chestnut Ct
- 32 Chestnut Ct
- 14 Indian Spring Ln
- 16 Indian Spring Ln
- 12 Indian Spring Ln
- 11 Indian Spring Ln