
Landlord's Agent in 2022
Peter Klemm
Klemm Real Estate Inc
(917) 864-4940
19 in this area
103 Total Sales
Estimated Value: $1,275,000 - $1,662,000
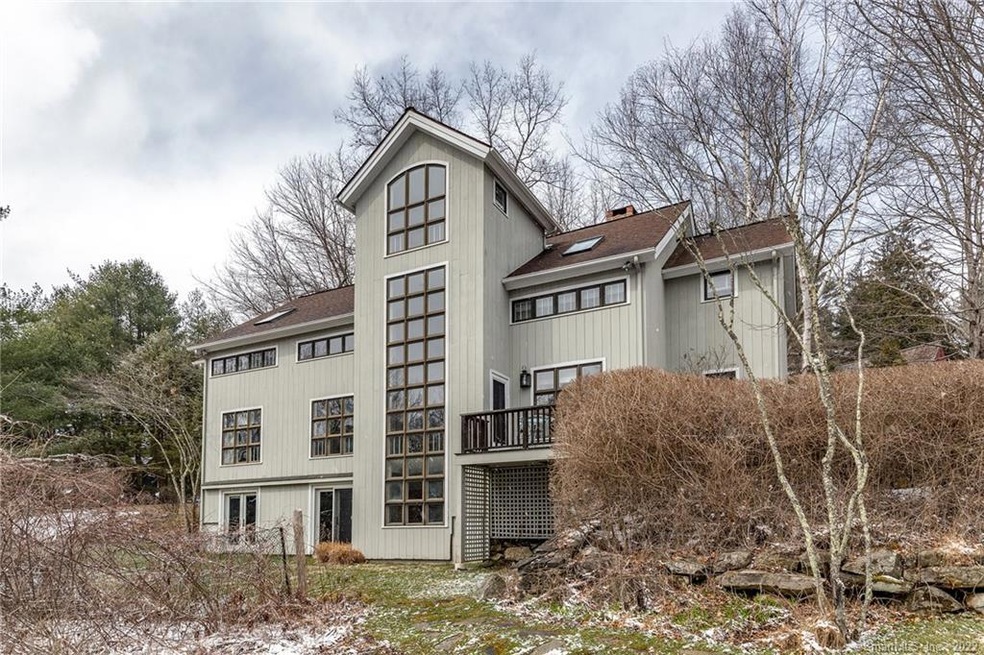
Fabulous 6-bedroom, barn-style, fully furnished guest house on a significant river-side Roxbury estate with soaring ceilings and a wall of floor-to-ceiling windows. 2 first floor bedrooms with queen-sized beds, en suite offices, and full baths. First floor open floorplan: Living-Dining-Kitchen with plenty of other places to find privacy. Upstairs there are 4 more bedrooms - 2 with queen-sized beds, en suite full baths and en suite ancillary rooms that could be offices/nurseries and 2 adorable single bedded rooms. A charming, lofted room with beautiful views tops off the third floor. Finished, walk-out lower level is outfitted as a game room complete with pool/ping-pong table, air hockey, Pac-Man and a large-screen TV. Buyers have access to a shared pool and tennis court—very rarely used by anyone else. This is a unique opportunity to spend the summer on an incomparable 100-acre estate without the usual expense. All utilities, lawn and pool care included. Rare offering. June: $16,500 or August: $20,000
Last Agent to Rent the Property
Klemm Real Estate Inc License #REB.0366645 Listed on: 03/30/2022
| Date | Event | Price | List to Sale | Price per Sq Ft | Prior Sale |
|---|---|---|---|---|---|
| 07/04/2022 07/04/22 | Rented | $17,500 | +6.1% | -- | |
| 07/01/2022 07/01/22 | Under Contract | -- | -- | -- | |
| 03/30/2022 03/30/22 | For Rent | $16,500 | 0.0% | -- | |
| 06/01/2012 06/01/12 | Sold | $2,675,000 | -45.4% | $342 / Sq Ft | View Prior Sale |
| 02/20/2012 02/20/12 | Pending | -- | -- | -- | |
| 08/17/2011 08/17/11 | For Sale | $4,900,000 | -- | $626 / Sq Ft |
| Year | Tax Paid | Tax Assessment Tax Assessment Total Assessment is a certain percentage of the fair market value that is determined by local assessors to be the total taxable value of land and additions on the property. | Land | Improvement |
|---|---|---|---|---|
| 2025 | $11,190 | $860,790 | $342,160 | $518,630 |
| 2024 | $10,846 | $860,790 | $342,160 | $518,630 |
| 2023 | $10,846 | $860,790 | $342,160 | $518,630 |
| 2022 | $13,252 | $869,010 | $533,720 | $335,290 |
| 2021 | $13,383 | $869,010 | $533,720 | $335,290 |
| 2020 | $13,730 | $869,010 | $533,720 | $335,290 |
| 2019 | $13,774 | $869,010 | $533,720 | $335,290 |
| 2018 | $13,774 | $869,010 | $533,720 | $335,290 |
| 2017 | $12,092 | $851,540 | $567,470 | $284,070 |
| 2016 | $11,848 | $864,800 | $567,470 | $297,330 |
| 2015 | $11,848 | $864,800 | $567,470 | $297,330 |
| 2014 | $11,588 | $864,800 | $567,470 | $297,330 |
Landlord's Agent in 2022
Peter Klemm
Klemm Real Estate Inc
(917) 864-4940
19 in this area
103 Total Sales
Seller's Agent in 2012
Kathryn Clair
William Pitt
(860) 868-6600
32 in this area
110 Total Sales
Buyer's Agent in 2012
Graham Klemm
Klemm Real Estate Inc
(860) 488-6635
15 in this area
111 Total Sales
Source: SmartMLS
MLS Number: 170478024
APN: ROXB-000009-000000-000006
Disclaimer: Certain information contained herein is derived from information provided by parties other than Homes.com. All information provided is deemed reliable, but is not guaranteed to be accurate and should be independently verified.
![]() IDX information is provided exclusively for personal, non-commercial use, and may not be used for any purpose other than to identify prospective properties consumers may be interested in purchasing. Information is deemed reliable but not guaranteed.
IDX information is provided exclusively for personal, non-commercial use, and may not be used for any purpose other than to identify prospective properties consumers may be interested in purchasing. Information is deemed reliable but not guaranteed.
Ask me questions while you tour the home.