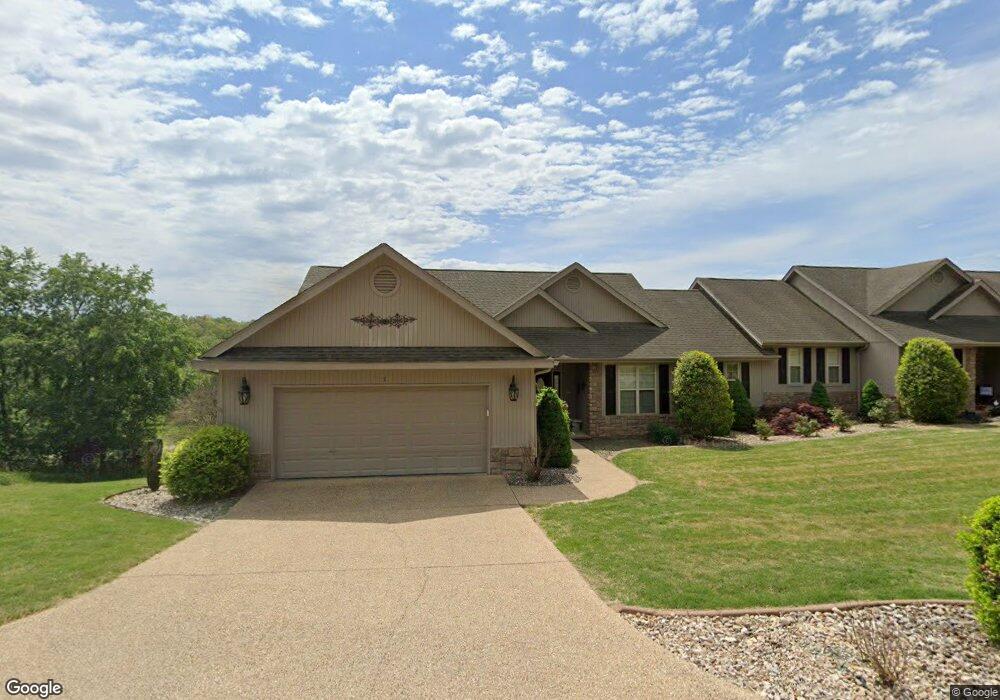
1 Tanyard Dr Bella Vista, AR 72715
Estimated Value: $557,000 - $644,000
3
Beds
2
Baths
1,654
Sq Ft
$351/Sq Ft
Est. Value
About This Home
This home is located at 1 Tanyard Dr, Bella Vista, AR 72715 and is currently estimated at $580,868, approximately $351 per square foot. 1 Tanyard Dr is a home located in Benton County with nearby schools including Cooper Elementary School, Old High Middle School, and Washington Junior High School.
Ownership History
Date
Name
Owned For
Owner Type
Purchase Details
Closed on
Oct 6, 2017
Sold by
Garza Rudy and Garza Kathy
Bought by
Worth Clarence J and Worth Demaris E
Current Estimated Value
Purchase Details
Closed on
Aug 1, 2013
Sold by
Hill Timothy
Bought by
Garza Rudy and Garza Kathy
Purchase Details
Closed on
Nov 4, 2010
Sold by
Hill Timothy
Bought by
Hill Timothy
Purchase Details
Closed on
May 19, 2006
Sold by
Cooper Homes Inc
Bought by
Hill Bruce D and Hill Patricia A
Purchase Details
Closed on
Jan 4, 2006
Sold by
Cooper Communities Inc
Bought by
Cooper Homes Linc
Create a Home Valuation Report for This Property
The Home Valuation Report is an in-depth analysis detailing your home's value as well as a comparison with similar homes in the area
Home Values in the Area
Average Home Value in this Area
Purchase History
| Date | Buyer | Sale Price | Title Company |
|---|---|---|---|
| Worth Clarence J | $325,000 | None Available | |
| Garza Rudy | $245,000 | Lenders Title Company | |
| Hill Timothy | -- | None Available | |
| Hill Bruce D | $325,000 | None Available | |
| Cooper Homes Linc | -- | None Available |
Source: Public Records
Tax History Compared to Growth
Tax History
| Year | Tax Paid | Tax Assessment Tax Assessment Total Assessment is a certain percentage of the fair market value that is determined by local assessors to be the total taxable value of land and additions on the property. | Land | Improvement |
|---|---|---|---|---|
| 2025 | $3,201 | $94,398 | $11,000 | $83,398 |
| 2024 | $3,168 | $94,398 | $11,000 | $83,398 |
| 2023 | $3,168 | $62,810 | $8,600 | $54,210 |
| 2022 | $2,895 | $62,810 | $8,600 | $54,210 |
| 2021 | $2,888 | $62,810 | $8,600 | $54,210 |
| 2020 | $2,917 | $51,680 | $6,600 | $45,080 |
| 2019 | $2,917 | $51,680 | $6,600 | $45,080 |
| 2018 | $2,942 | $51,680 | $6,600 | $45,080 |
| 2017 | $2,794 | $51,290 | $6,600 | $44,690 |
| 2016 | $2,794 | $51,290 | $6,600 | $44,690 |
| 2015 | $3,301 | $54,740 | $6,600 | $48,140 |
| 2014 | $2,951 | $54,740 | $6,600 | $48,140 |
Source: Public Records
Map
Nearby Homes