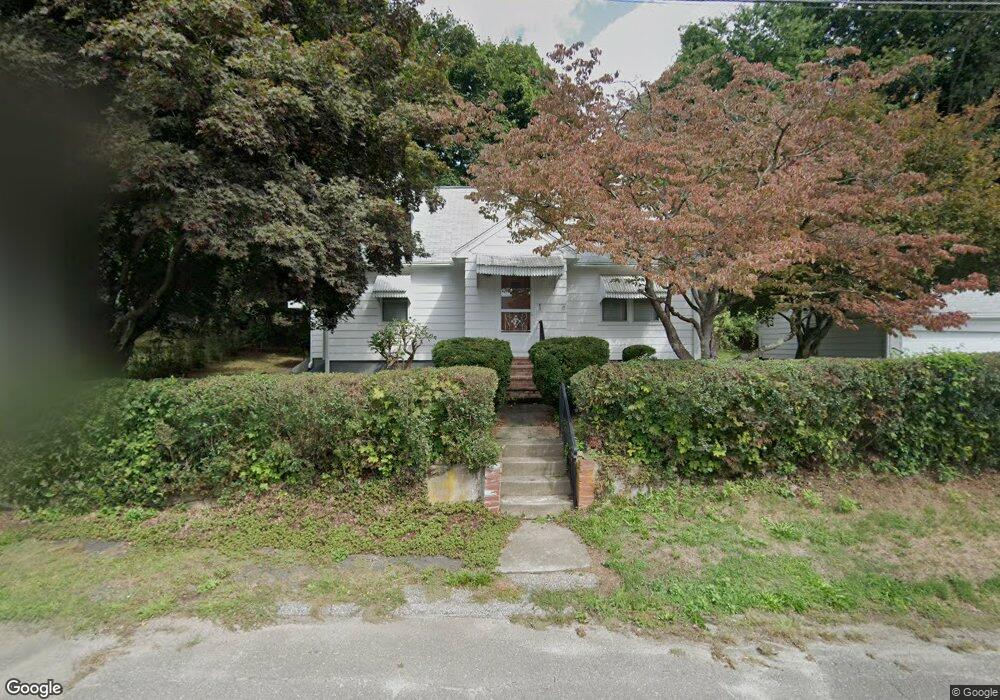
1 Thomas St Ansonia, CT 06401
Estimated Value: $277,000 - $323,000
3
Beds
1
Bath
1,142
Sq Ft
$263/Sq Ft
Est. Value
About This Home
This home is located at 1 Thomas St, Ansonia, CT 06401 and is currently estimated at $300,242, approximately $262 per square foot. 1 Thomas St is a home located in New Haven County with nearby schools including Ansonia Middle School, Ansonia High School, and St Mary & St Michael School.
Ownership History
Date
Name
Owned For
Owner Type
Purchase Details
Closed on
Jun 22, 2007
Sold by
Est Furlo Jennie M and Furlo Christine M
Bought by
Furlo Christine M
Current Estimated Value
Home Financials for this Owner
Home Financials are based on the most recent Mortgage that was taken out on this home.
Original Mortgage
$153,000
Outstanding Balance
$93,366
Interest Rate
6.14%
Estimated Equity
$206,876
Create a Home Valuation Report for This Property
The Home Valuation Report is an in-depth analysis detailing your home's value as well as a comparison with similar homes in the area
Home Values in the Area
Average Home Value in this Area
Purchase History
We collect this data history from publicly available records. To have your information removed, we recommend requesting removal directly through your county’s website.
| Date | Buyer | Sale Price | Title Company |
|---|---|---|---|
| Furlo Christine M | $153,333 | -- |
Source: Public Records
Mortgage History
We collect this data history from publicly available records. To have your information removed, we recommend requesting removal directly through your county’s website.
| Date | Status | Borrower | Loan Amount |
|---|---|---|---|
| Open | Furlo Christine M | $153,000 |
Source: Public Records
Tax History
| Year | Tax Paid | Tax Assessment Tax Assessment Total Assessment is a certain percentage of the fair market value that is determined by local assessors to be the total taxable value of land and additions on the property. | Land | Improvement |
|---|---|---|---|---|
| 2025 | $3,849 | $134,820 | $37,730 | $97,090 |
| 2024 | $3,571 | $134,820 | $37,730 | $97,090 |
| 2023 | $3,538 | $134,820 | $37,730 | $97,090 |
| 2022 | $3,617 | $95,700 | $35,400 | $60,300 |
| 2021 | $3,617 | $95,700 | $35,400 | $60,300 |
| 2020 | $3,617 | $95,700 | $35,400 | $60,300 |
| 2019 | $3,617 | $95,700 | $35,400 | $60,300 |
| 2018 | $3,572 | $95,700 | $35,400 | $60,300 |
| 2017 | $38 | $94,600 | $40,600 | $54,000 |
| 2016 | $3,530 | $94,600 | $40,600 | $54,000 |
| 2015 | $3,549 | $94,600 | $40,600 | $54,000 |
| 2014 | $3,653 | $94,600 | $40,600 | $54,000 |
| 2013 | $3,722 | $94,600 | $40,600 | $54,000 |
Source: Public Records
Map
Nearby Homes
- 6-8 Vose St
- 18 Columbia St
- 2 Gracie Ln
- 35 Park Place
- 24 Winesap Ct Unit 24
- 310-312 Derby Ave
- 273 Derby Ave Unit 904
- 233 Derby Ave Unit 315
- 233 Derby Ave Unit 503
- 25 Beechwood Dr
- 91 Division St
- 23 N Spring St
- 7 Cook St
- 13 Berkshire Cir
- 9 Alan Dr
- 15 Bruns Rd
- 118 Bradley Terrace
- 38 N Spring St
- 4 Fairview Terrace
- 101 Sunset Dr
Your Personal Tour Guide
Ask me questions while you tour the home.