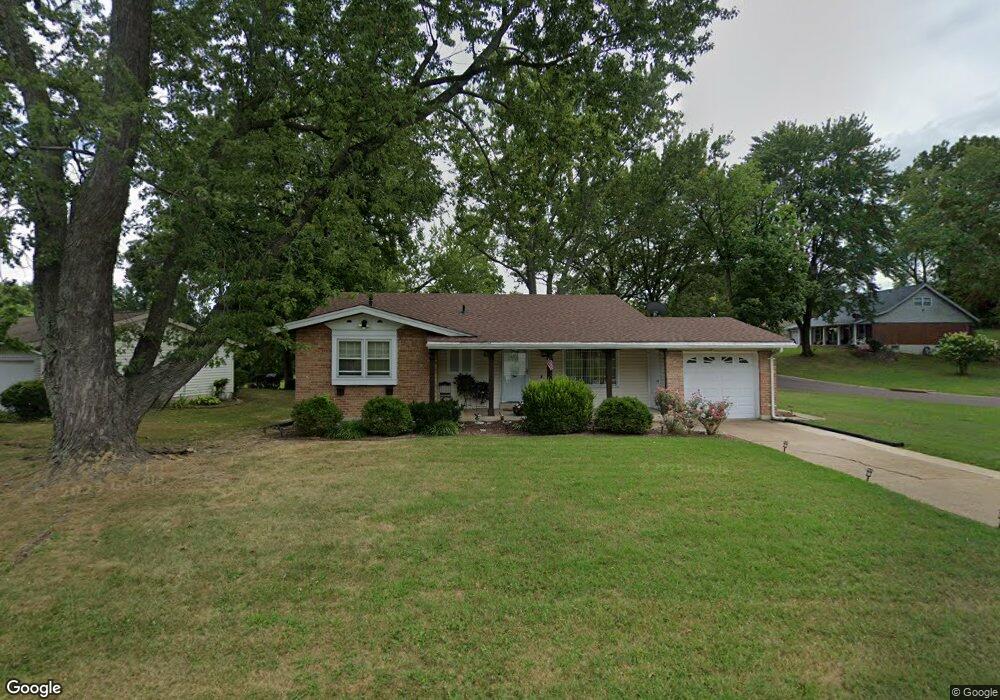
1 Thornton Abbey Ct Florissant, MO 63033
Estimated Value: $189,561 - $220,000
4
Beds
2
Baths
1,280
Sq Ft
$160/Sq Ft
Est. Value
About This Home
This home is located at 1 Thornton Abbey Ct, Florissant, MO 63033 and is currently estimated at $204,890, approximately $160 per square foot. 1 Thornton Abbey Ct is a home located in St. Louis County with nearby schools including Jury Elementary School, Central Middle School, and Hazelwood Central High School.
Ownership History
Date
Name
Owned For
Owner Type
Purchase Details
Closed on
Dec 18, 2009
Sold by
Berg Gregory and Berg Tracy L
Bought by
Jackson Carlos C
Current Estimated Value
Home Financials for this Owner
Home Financials are based on the most recent Mortgage that was taken out on this home.
Original Mortgage
$117,727
Outstanding Balance
$76,788
Interest Rate
4.9%
Mortgage Type
FHA
Estimated Equity
$128,102
Purchase Details
Closed on
Aug 7, 2009
Sold by
Secretary Of Housing & Urban Development
Bought by
Berg Gregory
Purchase Details
Closed on
Jan 13, 2009
Sold by
Matrix Financial Services
Bought by
Secretary Of Housing & Urban Development
Purchase Details
Closed on
Dec 18, 2008
Sold by
White Debra D
Bought by
Matrix Financial Services
Purchase Details
Closed on
Jun 5, 2001
Sold by
Mercedes Cobb
Bought by
White Debra D
Home Financials for this Owner
Home Financials are based on the most recent Mortgage that was taken out on this home.
Original Mortgage
$86,219
Interest Rate
7.1%
Mortgage Type
FHA
Create a Home Valuation Report for This Property
The Home Valuation Report is an in-depth analysis detailing your home's value as well as a comparison with similar homes in the area
Home Values in the Area
Average Home Value in this Area
Purchase History
| Date | Buyer | Sale Price | Title Company |
|---|---|---|---|
| Jackson Carlos C | $119,900 | None Available | |
| Berg Gregory | $40,000 | Fatco | |
| Secretary Of Housing & Urban Development | -- | None Available | |
| Matrix Financial Services | $96,149 | None Available | |
| White Debra D | $86,900 | -- | |
| White Debra D | -- | -- |
Source: Public Records
Mortgage History
| Date | Status | Borrower | Loan Amount |
|---|---|---|---|
| Open | Jackson Carlos C | $117,727 | |
| Previous Owner | White Debra D | $86,219 |
Source: Public Records
Tax History Compared to Growth
Tax History
| Year | Tax Paid | Tax Assessment Tax Assessment Total Assessment is a certain percentage of the fair market value that is determined by local assessors to be the total taxable value of land and additions on the property. | Land | Improvement |
|---|---|---|---|---|
| 2025 | $2,702 | $30,720 | $5,490 | $25,230 |
| 2024 | $2,702 | $29,970 | $3,670 | $26,300 |
| 2023 | $2,696 | $29,970 | $3,670 | $26,300 |
| 2022 | $2,185 | $20,640 | $4,770 | $15,870 |
| 2021 | $2,091 | $20,640 | $4,770 | $15,870 |
| 2020 | $1,867 | $17,440 | $4,220 | $13,220 |
| 2019 | $1,841 | $17,440 | $4,220 | $13,220 |
| 2018 | $1,918 | $16,780 | $2,930 | $13,850 |
| 2017 | $1,916 | $16,780 | $2,930 | $13,850 |
| 2016 | $1,941 | $16,690 | $3,290 | $13,400 |
| 2015 | $1,897 | $16,690 | $3,290 | $13,400 |
| 2014 | $1,942 | $16,980 | $3,550 | $13,430 |
Source: Public Records
Map
Nearby Homes
- 4950 Patricia Ridge Dr
- 11869 Galba Dr
- 11767 MacRinus Dr
- 11636 MacRinus Dr
- 12062 Cato Dr
- 30 Rolling Hills Dr
- 4493 Caracalla Dr
- 4497 Rhine Dr
- 4348 Vandals Dr
- 11519 Galba Dr
- 4471 Rhine Dr
- 4461 Rhine Dr
- 4244 Miletus Dr
- 5148 Longhorn Trail
- 12701 Old Halls Ferry Rd
- 11565 Mehl Ave
- 4354 Metarus Dr
- 4384 Remus Dr
- 4401 Rhine Dr
- 12415 Danube Dr
- 2 Thornton Abbey Ct
- 11890 Rollingsford Dr
- 11970 Rollingsford Dr
- 3 Thornton Abbey Ct
- 7 Thornton Abbey Ct
- 11925 Rollingsford Dr
- 11885 Rollingsford Dr
- 11880 Rollingsford Dr
- 4 Thornton Abbey Ct
- 11945 Rollingsford Dr
- 11990 Rollingsford Dr
- 11875 Rollingsford Dr
- 5 Thornton Abbey Ct
- 6 Thornton Abbey Ct
- 11965 Rollingsford Dr
- 4915 Wickham Fen Rd
- 12030 Rollingsford Dr
- 4870 Chalfont Rd
- 4925 Wickham Fen Rd
- 4820 Chalfont Rd