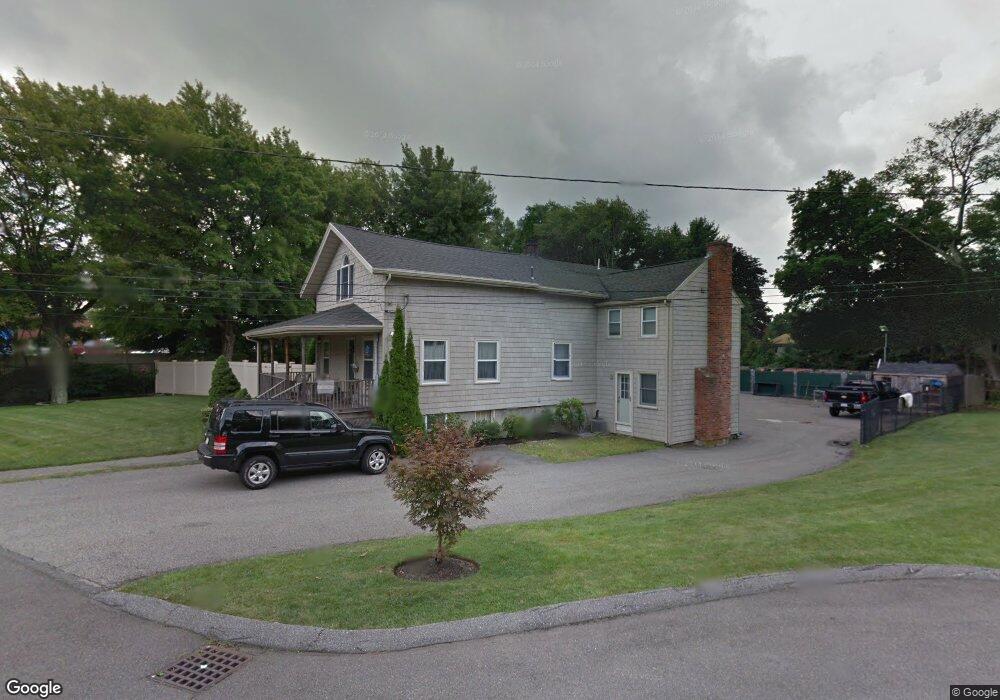
1 Toms Way Stoneham, MA 02180
Lindenwood NeighborhoodEstimated Value: $679,000 - $925,000
3
Beds
2
Baths
2,330
Sq Ft
$366/Sq Ft
Est. Value
About This Home
This home is located at 1 Toms Way, Stoneham, MA 02180 and is currently estimated at $852,299, approximately $365 per square foot. 1 Toms Way is a home located in Middlesex County with nearby schools including Stoneham High School, St. Patrick Elementary School, and St Joseph School.
Ownership History
Date
Name
Owned For
Owner Type
Purchase Details
Closed on
Aug 30, 1996
Sold by
Alice K Rt and Melkonian Alan K
Bought by
Seibold George E
Current Estimated Value
Home Financials for this Owner
Home Financials are based on the most recent Mortgage that was taken out on this home.
Original Mortgage
$121,500
Interest Rate
8.18%
Mortgage Type
Purchase Money Mortgage
Purchase Details
Closed on
Aug 23, 1991
Sold by
Gloor Irving E and Gloor Nancy
Bought by
Moore Arthur and Moore Ruth F
Create a Home Valuation Report for This Property
The Home Valuation Report is an in-depth analysis detailing your home's value as well as a comparison with similar homes in the area
Home Values in the Area
Average Home Value in this Area
Purchase History
| Date | Buyer | Sale Price | Title Company |
|---|---|---|---|
| Seibold George E | $135,000 | -- | |
| Moore Arthur | $174,900 | -- |
Source: Public Records
Mortgage History
| Date | Status | Borrower | Loan Amount |
|---|---|---|---|
| Open | Moore Arthur | $195,000 | |
| Closed | Moore Arthur | $121,500 | |
| Closed | Moore Arthur | $0 |
Source: Public Records
Tax History Compared to Growth
Tax History
| Year | Tax Paid | Tax Assessment Tax Assessment Total Assessment is a certain percentage of the fair market value that is determined by local assessors to be the total taxable value of land and additions on the property. | Land | Improvement |
|---|---|---|---|---|
| 2025 | $7,759 | $758,500 | $364,700 | $393,800 |
| 2024 | $7,499 | $708,100 | $337,700 | $370,400 |
| 2023 | $7,347 | $661,900 | $310,700 | $351,200 |
| 2022 | $5,897 | $566,500 | $283,700 | $282,800 |
| 2021 | $5,857 | $541,300 | $265,700 | $275,600 |
| 2020 | $5,641 | $522,800 | $256,700 | $266,100 |
| 2019 | $5,471 | $487,600 | $238,700 | $248,900 |
| 2018 | $5,277 | $450,600 | $220,700 | $229,900 |
| 2017 | $5,283 | $426,400 | $211,700 | $214,700 |
| 2016 | $5,217 | $410,800 | $211,700 | $199,100 |
| 2015 | $5,183 | $399,900 | $211,700 | $188,200 |
| 2014 | $5,012 | $371,500 | $193,700 | $177,800 |
Source: Public Records
Map
Nearby Homes
- 159 Main St Unit 41C
- 20 Oak St
- 8 Steele St
- 1 Tremont St
- 21 Tremont St Unit A
- 405 William St
- 62 High St Unit 4
- 62 High St Unit 3
- 62 High St Unit Lot 12
- 62 High St Unit Lot 2
- 62 High St Unit Lot 7
- 62 High St Unit Lot 9
- 12 Cottage St
- 10 Pomeworth St Unit H
- 68 Main St Unit 36C
- 97 Oak St
- 106 Elm St
- 64 Main St Unit 41B
- 25 Penny Ln
- 43 Pomeworth St Unit 44