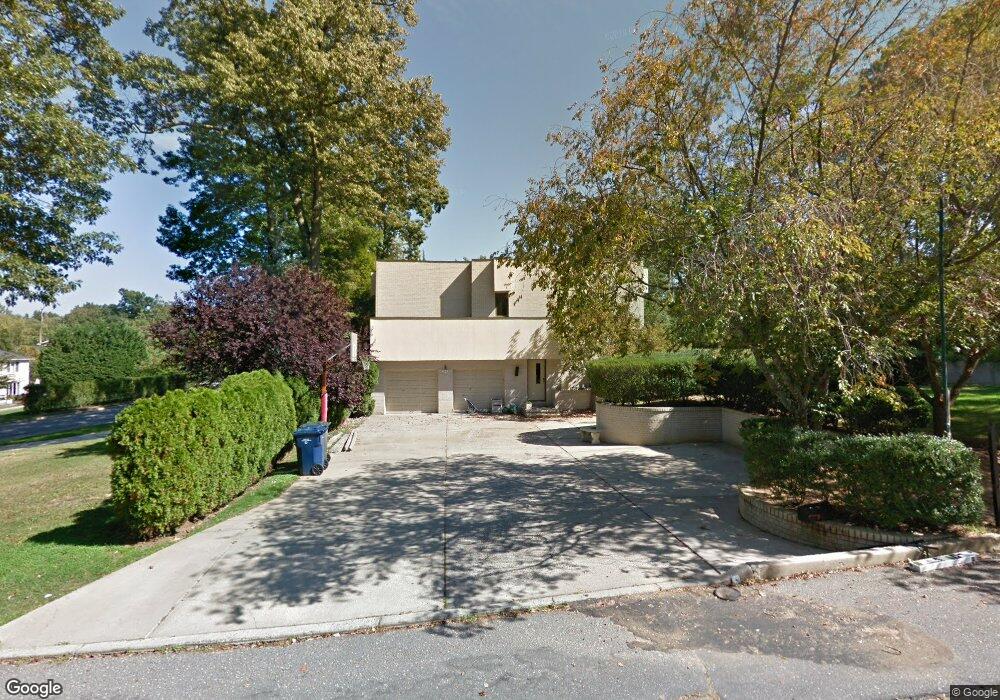
1 Tulip Ct Oakhurst, NJ 07755
Estimated Value: $3,980,898 - $4,871,000
5
Beds
2
Baths
5,985
Sq Ft
$761/Sq Ft
Est. Value
About This Home
This home is located at 1 Tulip Ct, Oakhurst, NJ 07755 and is currently estimated at $4,552,299, approximately $760 per square foot. 1 Tulip Ct is a home located in Monmouth County with nearby schools including Ocean Township High School, Bet Yaakov of the Jersey Shore, and Bnot Shirah of Deal.
Ownership History
Date
Name
Owned For
Owner Type
Purchase Details
Closed on
Jan 25, 2013
Sold by
Nationstar Mortgage Llc
Bought by
Hakim Eddie and Hakim Brenda
Current Estimated Value
Create a Home Valuation Report for This Property
The Home Valuation Report is an in-depth analysis detailing your home's value as well as a comparison with similar homes in the area
Home Values in the Area
Average Home Value in this Area
Purchase History
| Date | Buyer | Sale Price | Title Company |
|---|---|---|---|
| Hakim Eddie | $7,756 | None Available | |
| Nationastar Mortgage Llc | -- | None Available |
Source: Public Records
Tax History
| Year | Tax Paid | Tax Assessment Tax Assessment Total Assessment is a certain percentage of the fair market value that is determined by local assessors to be the total taxable value of land and additions on the property. | Land | Improvement |
|---|---|---|---|---|
| 2025 | $46,674 | $3,529,000 | $2,317,000 | $1,212,000 |
| 2024 | $35,945 | $3,273,100 | $2,088,600 | $1,184,500 |
| 2023 | $35,945 | $2,350,900 | $1,838,600 | $512,300 |
| 2022 | $33,951 | $2,275,800 | $1,838,600 | $437,200 |
| 2021 | $33,094 | $1,727,800 | $1,403,400 | $324,400 |
| 2020 | $33,094 | $1,662,200 | $1,353,400 | $308,800 |
| 2019 | $28,636 | $1,404,400 | $1,103,400 | $301,000 |
| 2018 | $30,032 | $1,434,200 | $1,103,400 | $330,800 |
| 2017 | $29,442 | $1,400,000 | $1,103,400 | $296,600 |
| 2016 | $32,463 | $1,388,500 | $570,100 | $818,400 |
| 2015 | $31,093 | $1,346,600 | $549,400 | $797,200 |
| 2014 | $29,819 | $1,309,000 | $543,400 | $765,600 |
Source: Public Records
Map
Nearby Homes
Your Personal Tour Guide
Ask me questions while you tour the home.