Estimated Value: $274,000 - $336,000
33
Beds
2
Baths
1,240
Sq Ft
$244/Sq Ft
Est. Value
About This Home
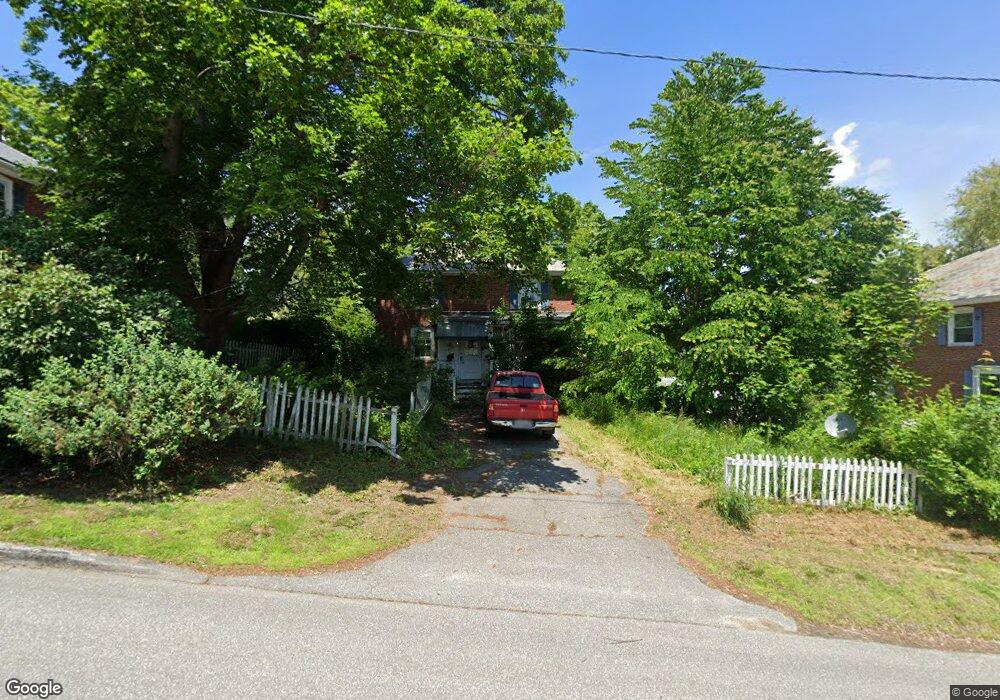
This home is located at 1 W Milan St, Bath, ME 04530 and is currently estimated at $301,951, approximately $243 per square foot. 1 W Milan St is a home located in Sagadahoc County with nearby schools including Morse High School and Hyde School.
Ownership History
Date
Name
Owned For
Owner Type
Purchase Details
Closed on
Aug 22, 2024
Sold by
Hoare Molly E
Bought by
Macgregor Terry R
Current Estimated Value
Purchase Details
Closed on
Apr 30, 2007
Sold by
Stehle Kathleen A
Bought by
Hoare Molly E
Home Financials for this Owner
Home Financials are based on the most recent Mortgage that was taken out on this home.
Original Mortgage
$148,000
Interest Rate
6.18%
Mortgage Type
Unknown
Create a Home Valuation Report for This Property
The Home Valuation Report is an in-depth analysis detailing your home's value as well as a comparison with similar homes in the area
Home Values in the Area
Average Home Value in this Area
Purchase History
| Date | Buyer | Sale Price | Title Company |
|---|---|---|---|
| Macgregor Terry R | $222,106 | None Available | |
| Hoare Molly E | -- | -- | |
| Hoare Molly E | -- | -- |
Source: Public Records
Mortgage History
| Date | Status | Borrower | Loan Amount |
|---|---|---|---|
| Previous Owner | Hoare Molly E | $4,053 | |
| Previous Owner | Hoare Molly E | $148,000 |
Source: Public Records
Tax History
| Year | Tax Paid | Tax Assessment Tax Assessment Total Assessment is a certain percentage of the fair market value that is determined by local assessors to be the total taxable value of land and additions on the property. | Land | Improvement |
|---|---|---|---|---|
| 2025 | $3,545 | $220,200 | $59,700 | $160,500 |
| 2024 | $3,232 | $195,900 | $56,900 | $139,000 |
| 2023 | $3,040 | $179,900 | $49,800 | $130,100 |
| 2022 | $2,736 | $134,100 | $30,800 | $103,300 |
| 2021 | $2,722 | $134,100 | $30,800 | $103,300 |
| 2020 | $2,682 | $134,100 | $30,800 | $103,300 |
| 2019 | $2,655 | $134,100 | $30,800 | $103,300 |
| 2018 | $2,592 | $118,900 | $20,900 | $98,000 |
| 2017 | $2,539 | $118,900 | $20,900 | $98,000 |
| 2016 | $2,509 | $118,900 | $20,900 | $98,000 |
| 2015 | $2,461 | $118,900 | $20,900 | $98,000 |
| 2014 | $2,402 | $118,900 | $20,900 | $98,000 |
| 2013 | $2,335 | $118,900 | $20,900 | $98,000 |
Source: Public Records
Map
Nearby Homes
Your Personal Tour Guide
Ask me questions while you tour the home.