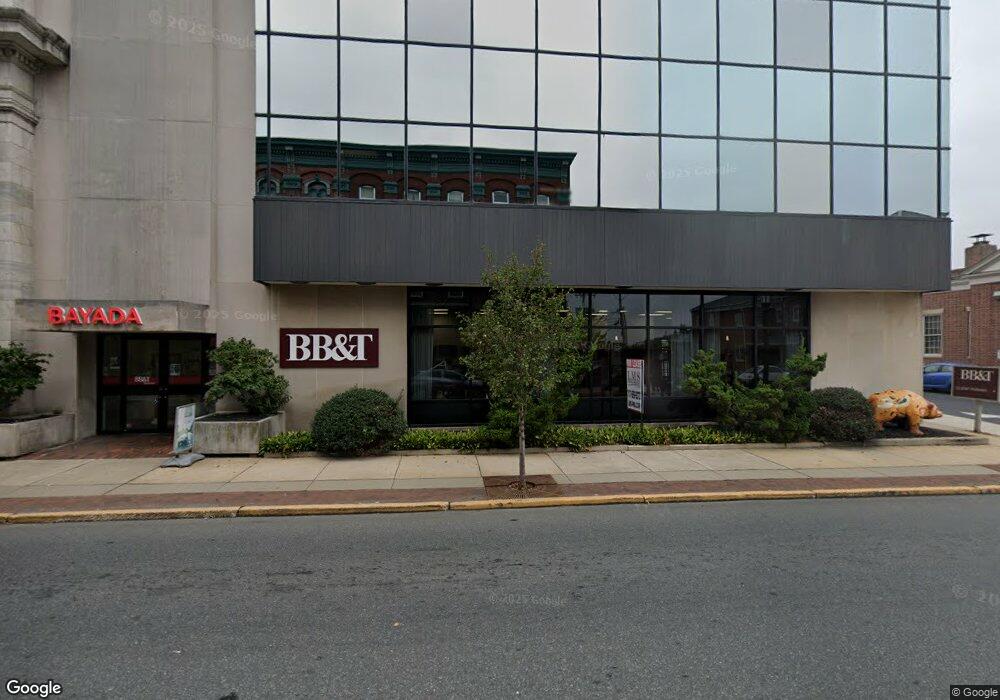
1 W Philadelphia Ave Unit 3RD & 4TH FLOORS Boyertown, PA 19512
Estimated Value: $3,272,966
--
Bed
--
Bath
20,000
Sq Ft
$164/Sq Ft
Est. Value
About This Home
This home is located at 1 W Philadelphia Ave Unit 3RD & 4TH FLOORS, Boyertown, PA 19512 and is currently estimated at $3,272,966, approximately $163 per square foot. 1 W Philadelphia Ave Unit 3RD & 4TH FLOORS is a home located in Berks County with nearby schools including Boyertown Area Senior High School and Brookeside Montessori School.
Ownership History
Date
Name
Owned For
Owner Type
Purchase Details
Closed on
Jun 21, 2019
Sold by
Blackford Development Ltd
Bought by
Strasburg Square Properties Llc
Current Estimated Value
Home Financials for this Owner
Home Financials are based on the most recent Mortgage that was taken out on this home.
Original Mortgage
$1,350,000
Outstanding Balance
$1,186,980
Interest Rate
4.1%
Mortgage Type
Future Advance Clause Open End Mortgage
Estimated Equity
$2,085,986
Purchase Details
Closed on
Mar 28, 2019
Sold by
Branch Banking And Trust Company
Bought by
Blackford Development Ltd
Home Financials for this Owner
Home Financials are based on the most recent Mortgage that was taken out on this home.
Original Mortgage
$850,000
Interest Rate
4.3%
Mortgage Type
Unknown
Purchase Details
Closed on
Jan 30, 1953
Bought by
Natl Bank Of Boyertown Attn: Controller
Create a Home Valuation Report for This Property
The Home Valuation Report is an in-depth analysis detailing your home's value as well as a comparison with similar homes in the area
Home Values in the Area
Average Home Value in this Area
Purchase History
| Date | Buyer | Sale Price | Title Company |
|---|---|---|---|
| Strasburg Square Properties Llc | $2,000,000 | Red Rose Abstract Co | |
| Blackford Development Ltd | $815,000 | Red Rose Abstract Co | |
| Natl Bank Of Boyertown Attn: Controller | -- | -- |
Source: Public Records
Mortgage History
| Date | Status | Borrower | Loan Amount |
|---|---|---|---|
| Open | Strasburg Square Properties Llc | $1,350,000 | |
| Previous Owner | Blackford Development Ltd | $850,000 |
Source: Public Records
Tax History Compared to Growth
Tax History
| Year | Tax Paid | Tax Assessment Tax Assessment Total Assessment is a certain percentage of the fair market value that is determined by local assessors to be the total taxable value of land and additions on the property. | Land | Improvement |
|---|---|---|---|---|
| 2025 | $11,831 | $612,900 | $104,900 | $508,000 |
| 2024 | $29,541 | $612,900 | $104,900 | $508,000 |
| 2023 | $43,695 | $945,500 | $104,900 | $840,600 |
| 2022 | $42,446 | $945,500 | $104,900 | $840,600 |
| 2021 | $40,985 | $945,500 | $104,900 | $840,600 |
| 2020 | $40,020 | $945,500 | $104,900 | $840,600 |
| 2019 | $15,582 | $945,500 | $104,900 | $840,600 |
| 2018 | $36,891 | $945,500 | $104,900 | $840,600 |
| 2017 | $57,448 | $1,520,500 | $115,100 | $1,405,400 |
| 2016 | $19,389 | $1,520,500 | $115,100 | $1,405,400 |
| 2015 | $19,389 | $1,520,500 | $115,100 | $1,405,400 |
| 2014 | $18,644 | $1,520,500 | $115,100 | $1,405,400 |
Source: Public Records
Map
Nearby Homes
- 0 W Philadelphia Ave
- 100 College St
- 151 S Reading Ave
- 119 Schaeffer St
- 231 N Franklin St
- 332 S Reading Ave
- 622 Rhoads Ave
- 626 N Reading Ave
- 201 Henry Ave
- 241 Sweinhart Rd
- 1028 Weisstown Rd
- Norris Plan at Spring Garden Meadows
- 60 Foxwood Dr
- 23 Foxwood Dr
- 34 Chestnut Ln
- 25 Hunters Dr
- 24 Alans Ln
- 16 Hunters Dr
- 11 Linden Ct Unit 11
- 280 Indian Ln
- 1 W Philadelphia Ave
- 5 W Philadelphia Ave
- Parcel 42-5368-04-74 Pennsylvania 73
- 3801 Route 73
- 0 Route 562 Unit 1007969392
- 0 Route 562 Unit 1000254007
- 0 Route 562 Unit 246562
- 0 Route 562 Unit 258030
- 0 Route 562 Unit 6884570
- 0 Route 562 Unit 6729185
- 0 Route 562 Unit 512962
- 0 Route 562 Unit 533876
- 3 W Philadelphia Ave
- 19 N Reading Ave Unit LOWER
- 19 N Reading Ave
- 0 S Reading Ave
- 8 W Philadelphia Ave
- 0000 S Reading Ave
- 000 S Reading Ave
- 11 E Philadelphia Ave