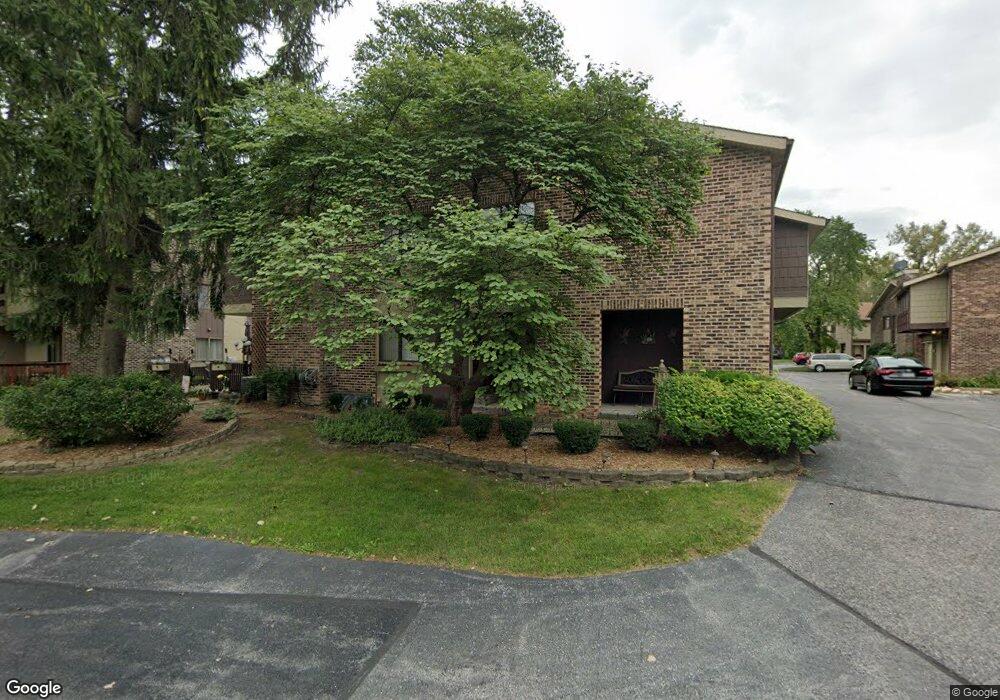
1 W Stonebridge Ct Unit 1B Palos Hills, IL 60465
Estimated Value: $235,000 - $288,000
3
Beds
2
Baths
1,300
Sq Ft
$198/Sq Ft
Est. Value
About This Home
This home is located at 1 W Stonebridge Ct Unit 1B, Palos Hills, IL 60465 and is currently estimated at $257,121, approximately $197 per square foot. 1 W Stonebridge Ct Unit 1B is a home located in Cook County with nearby schools including Palos East Elementary School, Palos South Middle School, and Amos Alonzo Stagg High School.
Ownership History
Date
Name
Owned For
Owner Type
Purchase Details
Closed on
Jul 17, 2007
Sold by
Susik Andrzej J and Susik Ewa Aleksandra
Bought by
Dalianis Panteleimon G and Dalianis Konstantina M
Current Estimated Value
Home Financials for this Owner
Home Financials are based on the most recent Mortgage that was taken out on this home.
Original Mortgage
$173,000
Outstanding Balance
$106,711
Interest Rate
6.25%
Mortgage Type
Unknown
Estimated Equity
$150,410
Purchase Details
Closed on
Aug 16, 2004
Sold by
Founders Bank
Bought by
Susik Andrzej and Susik Ewa
Home Financials for this Owner
Home Financials are based on the most recent Mortgage that was taken out on this home.
Original Mortgage
$184,200
Interest Rate
5.93%
Mortgage Type
Unknown
Create a Home Valuation Report for This Property
The Home Valuation Report is an in-depth analysis detailing your home's value as well as a comparison with similar homes in the area
Home Values in the Area
Average Home Value in this Area
Purchase History
| Date | Buyer | Sale Price | Title Company |
|---|---|---|---|
| Dalianis Panteleimon G | $220,000 | Ticor Title Insurance Co | |
| Susik Andrzej | $190,000 | Ticor Title |
Source: Public Records
Mortgage History
| Date | Status | Borrower | Loan Amount |
|---|---|---|---|
| Open | Dalianis Panteleimon G | $173,000 | |
| Previous Owner | Susik Andrzej | $184,200 |
Source: Public Records
Tax History Compared to Growth
Tax History
| Year | Tax Paid | Tax Assessment Tax Assessment Total Assessment is a certain percentage of the fair market value that is determined by local assessors to be the total taxable value of land and additions on the property. | Land | Improvement |
|---|---|---|---|---|
| 2024 | $4,029 | $19,430 | $3,014 | $16,416 |
| 2023 | $3,337 | $19,430 | $3,014 | $16,416 |
| 2022 | $3,337 | $14,152 | $3,222 | $10,930 |
| 2021 | $3,139 | $14,150 | $3,221 | $10,929 |
| 2020 | $3,091 | $14,150 | $3,221 | $10,929 |
| 2019 | $2,373 | $12,123 | $2,909 | $9,214 |
| 2018 | $2,256 | $12,123 | $2,909 | $9,214 |
| 2017 | $2,212 | $12,123 | $2,909 | $9,214 |
| 2016 | $2,093 | $10,154 | $2,494 | $7,660 |
| 2015 | $2,088 | $10,351 | $2,494 | $7,857 |
| 2014 | $2,077 | $10,351 | $2,494 | $7,857 |
| 2013 | $1,772 | $9,733 | $2,494 | $7,239 |
Source: Public Records
Map
Nearby Homes
- 11001 Stony Creek Dr Unit 2C
- 11015 S 84th Ave Unit 3C
- 8202 Gruener Ct
- 11015 S Theresa Cir Unit 3
- 10927 Circle Dr
- 11109 S 84th Ave Unit 1B
- 8216 Mulberry Ct Unit 8B
- 8216 Mulberry Ct Unit 8A
- 8048 W 111th St
- 8058 Circle Dr
- 11050 S Roberts Rd
- 11133 S 84th Ave Unit 3A
- 8246 Holly Ct Unit D
- 10820 Kathleen Ct Unit D
- 5 Cour Caravelle
- 26 Cour Versaille Unit 26
- 11301 Sycamore Ln Unit 64A
- 19 Cour Leroux
- 10441 S 83rd Ave
- 7801 W 111th St
- 1 W Stonebridge Ct Unit 12B
- 1 W Stonebridge Ct Unit 12C
- 1 W Stonebridge Ct Unit 12A
- 4 Stony Creek Dr Unit 11A
- 4 Stony Creek Dr Unit 11B
- 4 Stony Creek Dr Unit 11C
- 4 Stony Creek Dr Unit A
- 6 W Millstone Ct Unit 10A
- 6 W Millstone Ct Unit 10B
- 6 W Millstone Ct Unit 10C
- 6 W Millstone Ct Unit B
- 6 W Millstone Ct Unit 6A
- 2 W Stonebridge Ct Unit 22C
- 2 W Stonebridge Ct Unit 22B
- 2 W Stonebridge Ct Unit 22A
- 2 W Stonebridge Ct Unit 2B
- 2 W Stonebridge Ct Unit C
- 5 W Millstone Ct Unit A
- 5 W Millstone Ct Unit 23A
- 5 W Millstone Ct Unit 23B