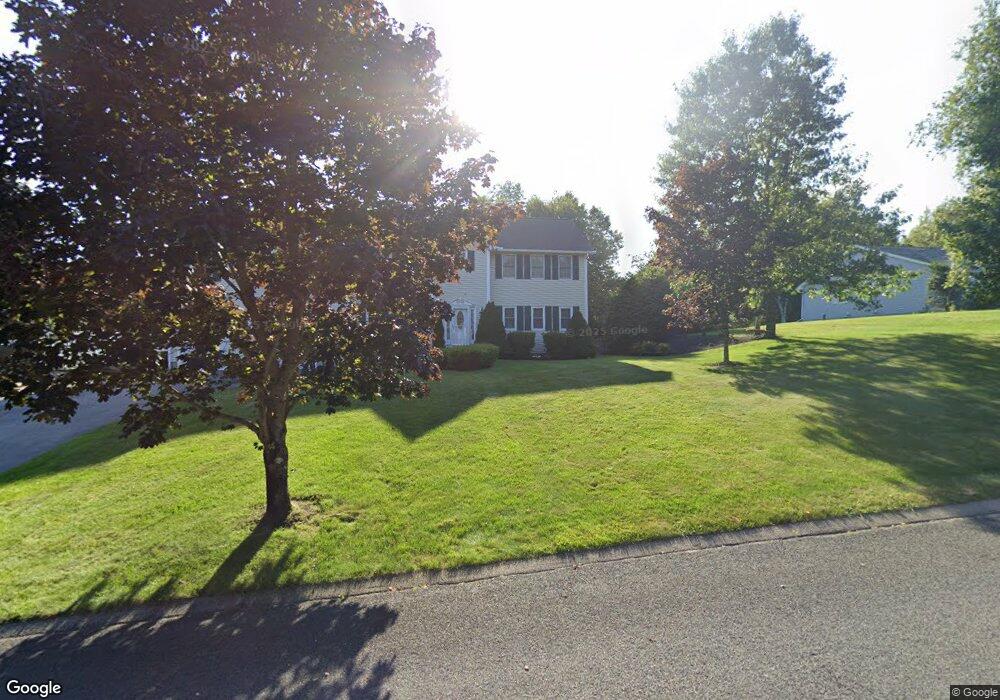
1 Wakefield Dr Charlton, MA 01507
Estimated Value: $627,000 - $790,000
4
Beds
3
Baths
2,200
Sq Ft
$326/Sq Ft
Est. Value
About This Home
This home is located at 1 Wakefield Dr, Charlton, MA 01507 and is currently estimated at $717,216, approximately $326 per square foot. 1 Wakefield Dr is a home located in Worcester County with nearby schools including Shepherd Hill Regional High School.
Ownership History
Date
Name
Owned For
Owner Type
Purchase Details
Closed on
May 21, 2010
Sold by
Campbell John M and Campbell Tracy A
Bought by
Terry Robert A and Terry Jamie L
Current Estimated Value
Home Financials for this Owner
Home Financials are based on the most recent Mortgage that was taken out on this home.
Original Mortgage
$338,751
Outstanding Balance
$223,280
Interest Rate
4.87%
Mortgage Type
FHA
Estimated Equity
$493,936
Purchase Details
Closed on
Jul 1, 1999
Sold by
Newgem Bldrs Inc
Bought by
Campbell John M and Campbell Tracy A
Home Financials for this Owner
Home Financials are based on the most recent Mortgage that was taken out on this home.
Original Mortgage
$157,500
Interest Rate
7.19%
Mortgage Type
Purchase Money Mortgage
Create a Home Valuation Report for This Property
The Home Valuation Report is an in-depth analysis detailing your home's value as well as a comparison with similar homes in the area
Home Values in the Area
Average Home Value in this Area
Purchase History
| Date | Buyer | Sale Price | Title Company |
|---|---|---|---|
| Terry Robert A | $345,000 | -- | |
| Terry Robert A | $345,000 | -- | |
| Campbell John M | $228,765 | -- | |
| Campbell John M | $228,765 | -- |
Source: Public Records
Mortgage History
| Date | Status | Borrower | Loan Amount |
|---|---|---|---|
| Open | Terry Robert A | $338,751 | |
| Closed | Campbell John M | $338,751 | |
| Previous Owner | Campbell John M | $181,000 | |
| Previous Owner | Campbell John M | $157,500 |
Source: Public Records
Tax History Compared to Growth
Tax History
| Year | Tax Paid | Tax Assessment Tax Assessment Total Assessment is a certain percentage of the fair market value that is determined by local assessors to be the total taxable value of land and additions on the property. | Land | Improvement |
|---|---|---|---|---|
| 2025 | $7,045 | $633,000 | $111,100 | $521,900 |
| 2024 | $7,068 | $623,300 | $105,100 | $518,200 |
| 2023 | $6,962 | $572,100 | $105,100 | $467,000 |
| 2022 | $5,877 | $442,200 | $93,100 | $349,100 |
| 2021 | $5,354 | $356,700 | $84,100 | $272,600 |
| 2020 | $5,266 | $352,500 | $79,900 | $272,600 |
| 2019 | $5,206 | $352,500 | $79,900 | $272,600 |
| 2018 | $4,737 | $350,900 | $79,900 | $271,000 |
| 2017 | $4,601 | $326,300 | $79,900 | $246,400 |
| 2016 | $4,612 | $334,700 | $79,900 | $254,800 |
| 2015 | $4,492 | $334,700 | $79,900 | $254,800 |
| 2014 | $4,294 | $339,200 | $81,700 | $257,500 |
Source: Public Records
Map
Nearby Homes