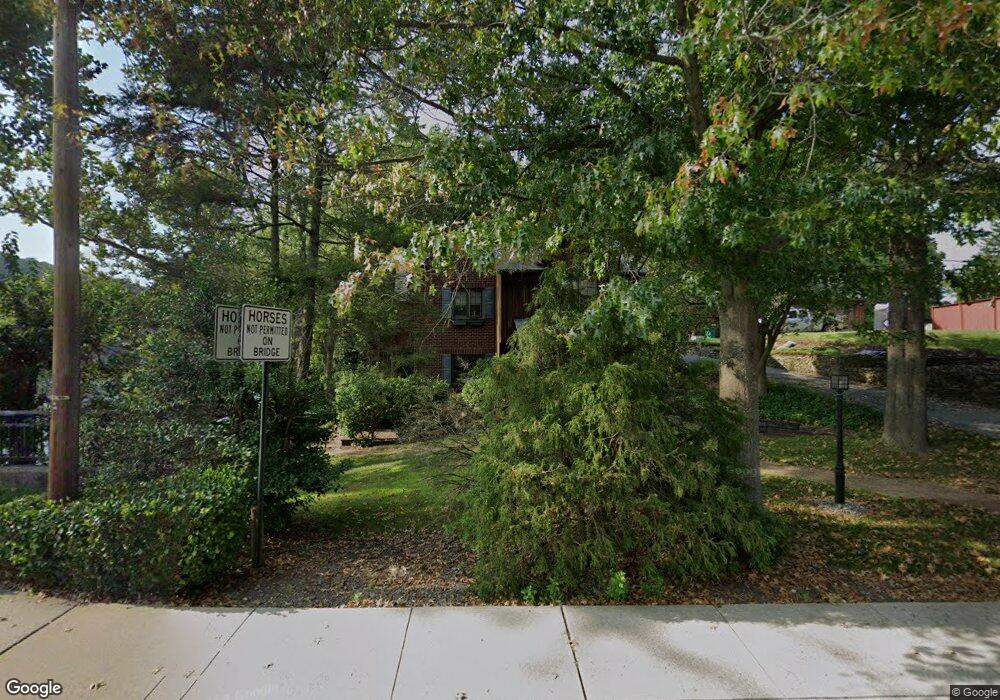
1 Water St Belvidere, NJ 07823
Estimated Value: $429,000 - $508,000
--
Bed
--
Bath
2,371
Sq Ft
$196/Sq Ft
Est. Value
About This Home
This home is located at 1 Water St, Belvidere, NJ 07823 and is currently estimated at $463,860, approximately $195 per square foot. 1 Water St is a home located in Warren County with nearby schools including Belvidere Elementary School, Third Street Elementary School, and Belvidere High School.
Ownership History
Date
Name
Owned For
Owner Type
Purchase Details
Closed on
Feb 14, 2019
Sold by
Inglima William S and Finley Jennifer A
Bought by
Inglima William S
Current Estimated Value
Purchase Details
Closed on
May 21, 2010
Sold by
Caflin Rondi and Caflin Patrick
Bought by
Inglima William S and Finley Jennifer A
Home Financials for this Owner
Home Financials are based on the most recent Mortgage that was taken out on this home.
Original Mortgage
$300,000
Interest Rate
5.12%
Mortgage Type
New Conventional
Purchase Details
Closed on
Feb 9, 2000
Sold by
Luna Rondi and Luna Michael C
Bought by
Luna Rondi
Create a Home Valuation Report for This Property
The Home Valuation Report is an in-depth analysis detailing your home's value as well as a comparison with similar homes in the area
Home Values in the Area
Average Home Value in this Area
Purchase History
| Date | Buyer | Sale Price | Title Company |
|---|---|---|---|
| Inglima William S | -- | First American Title Ins Co | |
| Inglima William S | $423,750 | First American Title Ins Co | |
| Luna Rondi | -- | -- |
Source: Public Records
Mortgage History
| Date | Status | Borrower | Loan Amount |
|---|---|---|---|
| Previous Owner | Inglima William S | $300,000 |
Source: Public Records
Tax History Compared to Growth
Tax History
| Year | Tax Paid | Tax Assessment Tax Assessment Total Assessment is a certain percentage of the fair market value that is determined by local assessors to be the total taxable value of land and additions on the property. | Land | Improvement |
|---|---|---|---|---|
| 2025 | $10,529 | $330,800 | $88,200 | $242,600 |
| 2024 | $10,182 | $330,800 | $88,200 | $242,600 |
| 2023 | $10,783 | $330,800 | $88,200 | $242,600 |
| 2022 | $10,783 | $183,600 | $41,000 | $142,600 |
| 2021 | $10,414 | $183,600 | $41,000 | $142,600 |
| 2020 | $10,456 | $183,600 | $41,000 | $142,600 |
| 2019 | $12,166 | $209,000 | $41,000 | $168,000 |
| 2018 | $12,166 | $209,000 | $41,000 | $168,000 |
| 2017 | $11,773 | $209,000 | $41,000 | $168,000 |
| 2016 | $11,625 | $209,000 | $41,000 | $168,000 |
| 2015 | $11,411 | $209,000 | $41,000 | $168,000 |
| 2014 | $11,330 | $209,000 | $41,000 | $168,000 |
Source: Public Records
Map
Nearby Homes