Estimated Value: $125,000 - $162,191
2
Beds
1
Bath
1,272
Sq Ft
$115/Sq Ft
Est. Value
About This Home
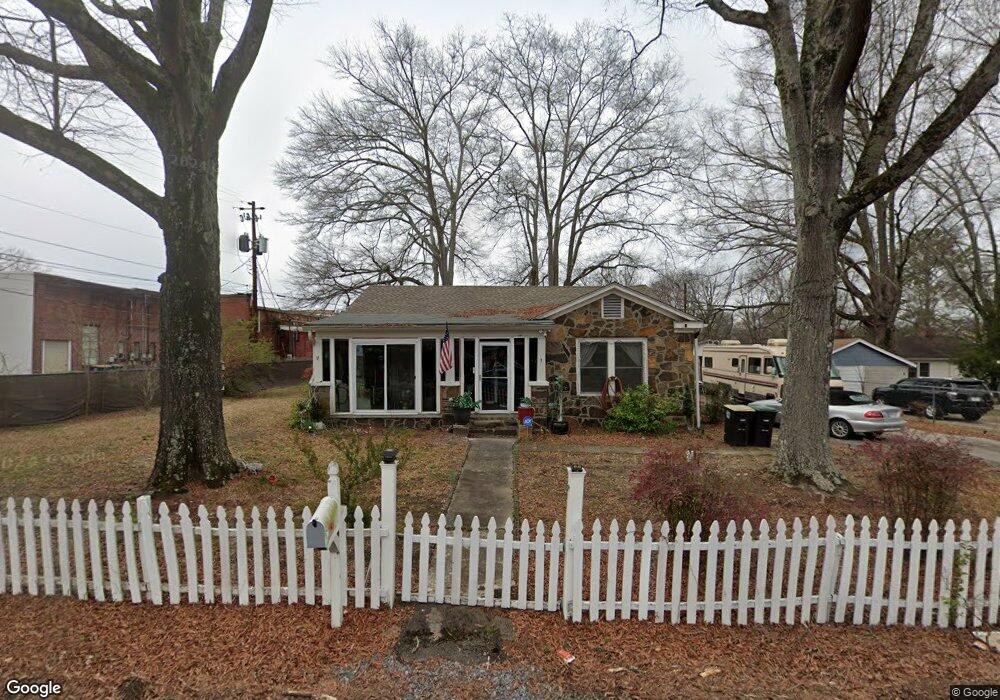
This home is located at 1 Webster St NW, Rome, GA 30165 and is currently estimated at $145,798, approximately $114 per square foot. 1 Webster St NW is a home located in Floyd County with nearby schools including Rome High School, St. Mary School, and Darlington School.
Ownership History
Date
Name
Owned For
Owner Type
Purchase Details
Closed on
Feb 11, 2020
Sold by
Manaut Jose Salvador Rodrig
Bought by
Diep Phuong
Current Estimated Value
Purchase Details
Closed on
Sep 28, 2018
Sold by
Diep Phuong
Bought by
Diep Phuong and Manaut Jose Salvador Rodrig
Purchase Details
Closed on
Apr 13, 2018
Sold by
Benito Abraham Ruiz
Bought by
Diep Phuong
Home Financials for this Owner
Home Financials are based on the most recent Mortgage that was taken out on this home.
Original Mortgage
$77,503
Interest Rate
4.44%
Mortgage Type
New Conventional
Purchase Details
Closed on
Jan 3, 2017
Sold by
Nora E
Bought by
Benito Abraham Ruiz and Ruiz Felipa Hortencia Cux
Purchase Details
Closed on
Mar 19, 2003
Sold by
Kelley Janiece D
Bought by
Dunervill Nora E and Dunderv Walter E
Purchase Details
Closed on
Apr 6, 2000
Sold by
Duke W L
Bought by
Kelley Janiece D
Purchase Details
Closed on
Jan 1, 1901
Bought by
Duke W L
Create a Home Valuation Report for This Property
The Home Valuation Report is an in-depth analysis detailing your home's value as well as a comparison with similar homes in the area
Home Values in the Area
Average Home Value in this Area
Purchase History
| Date | Buyer | Sale Price | Title Company |
|---|---|---|---|
| Diep Phuong | -- | -- | |
| Diep Phuong | -- | -- | |
| Diep Phuong | $79,900 | -- | |
| Benito Abraham Ruiz | $59,000 | -- | |
| Dunervill Nora E | $85,000 | -- | |
| Kelley Janiece D | -- | -- | |
| Duke W L | -- | -- |
Source: Public Records
Mortgage History
| Date | Status | Borrower | Loan Amount |
|---|---|---|---|
| Previous Owner | Diep Phuong | $77,503 |
Source: Public Records
Tax History Compared to Growth
Tax History
| Year | Tax Paid | Tax Assessment Tax Assessment Total Assessment is a certain percentage of the fair market value that is determined by local assessors to be the total taxable value of land and additions on the property. | Land | Improvement |
|---|---|---|---|---|
| 2024 | $410 | $39,261 | $12,096 | $27,165 |
| 2023 | $396 | $36,765 | $10,752 | $26,013 |
| 2022 | $416 | $30,392 | $8,736 | $21,656 |
| 2021 | $425 | $28,197 | $8,736 | $19,461 |
| 2020 | $431 | $25,136 | $6,720 | $18,416 |
| 2019 | $424 | $24,074 | $6,720 | $17,354 |
| 2018 | $852 | $23,013 | $6,720 | $16,293 |
| 2017 | $829 | $22,396 | $6,720 | $15,676 |
| 2016 | $815 | $21,933 | $6,720 | $15,213 |
| 2015 | $769 | $21,933 | $6,720 | $15,213 |
| 2014 | $769 | $21,933 | $6,720 | $15,213 |
Source: Public Records
Map
Nearby Homes
- 209 Sherwood Rd SW
- 9 Shorter Cir SW
- 17 Rosewood Rd SW
- 19 Berckman Ln SW
- 3 Berckman Ln SW
- 14 Berckman Ln SW
- 8 S Hughes St SW
- 0 Unbridled Rd Unit 22 23074684
- 13 Ridgewood Rd SW
- 0 Mount Alto Rd SW Unit 10523740
- 124 Sheridan Dr NW
- 6 Horseleg Creek Rd SW
- 23 Sweetspire Dr NW
- 21 Sweetspire Dr NW
- 614 Briarwood Cir NW
- 14 Vineland Dr NW
- 204 Oakwood St NW
- 808 Charlton St NW
- 1005 N 2nd Ave NW Unit 39
- PEARSON Plan at Shorter Village
- 3 Webster St NW
- 503 Decatur St NW
- 430 Shorter Ave NW Unit A
- 430 Shorter Ave NW
- 505 Decatur St NW
- 8 Webster St NW
- 0 Webster St NW Unit 7478005
- 0 Webster St NW Unit 7478006
- 507 Decatur St NW
- 427 Decatur St NW
- 506 Decatur St NW
- 432 Decatur St NW
- 425 Decatur St NW
- 511 Decatur St NW
- 103 Webster St NW
- 428 Decatur St NW
- 508 Decatur St NW
- 426 Decatur St NW
- 7 Pike St NW
- 102 Westmore Rd SW