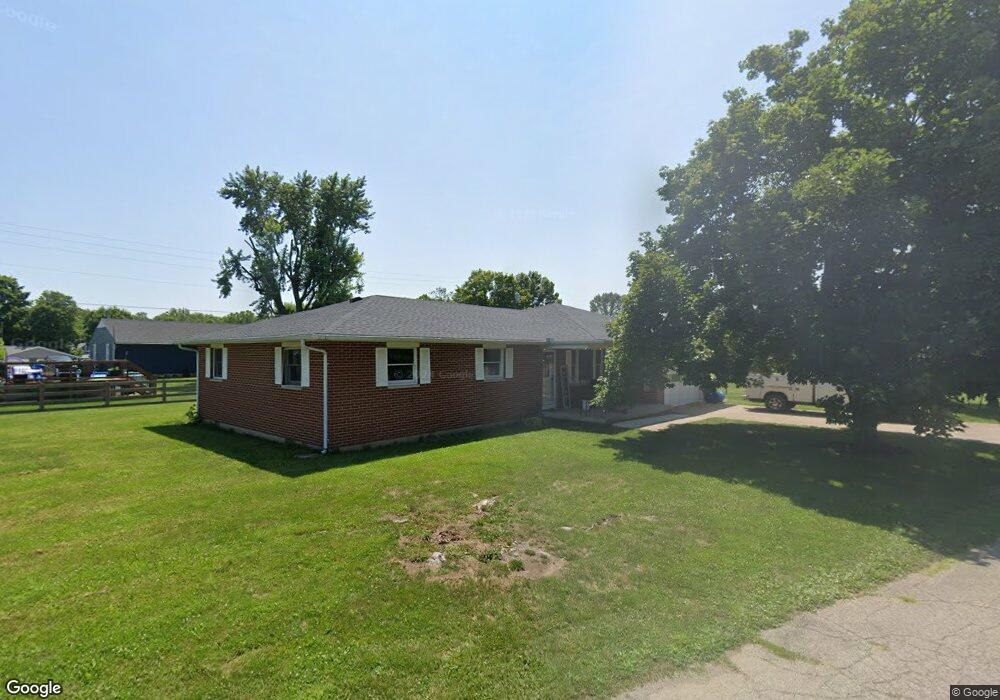
1 West St Camden, OH 45311
Estimated Value: $171,839 - $189,000
3
Beds
2
Baths
1,528
Sq Ft
$116/Sq Ft
Est. Value
About This Home
This home is located at 1 West St, Camden, OH 45311 and is currently estimated at $177,710, approximately $116 per square foot. 1 West St is a home located in Preble County with nearby schools including Preble Shawnee Elementary School, West Elkton Intermediate School, and Preble Shawnee Junior/Senior High School.
Ownership History
Date
Name
Owned For
Owner Type
Purchase Details
Closed on
Jul 20, 2021
Sold by
Michael Daniel R
Bought by
Michael Daniel R and Michael Judy L
Current Estimated Value
Purchase Details
Closed on
Jul 9, 2021
Sold by
Michael Daniel R and Michael Daniel R
Bought by
Michael Daniel R
Purchase Details
Closed on
Aug 9, 2016
Bought by
Michael Daniel R Jr Co Trustee & D
Home Financials for this Owner
Home Financials are based on the most recent Mortgage that was taken out on this home.
Interest Rate
3.43%
Purchase Details
Closed on
Sep 18, 2013
Sold by
Michael Darrell W
Bought by
Michael Darrell W and The Darrell W Michael Trust
Purchase Details
Closed on
Oct 6, 2003
Sold by
Brandenburg Debbie and Michael Charles
Bought by
Michael Darrell and Michael Lois
Create a Home Valuation Report for This Property
The Home Valuation Report is an in-depth analysis detailing your home's value as well as a comparison with similar homes in the area
Home Values in the Area
Average Home Value in this Area
Purchase History
| Date | Buyer | Sale Price | Title Company |
|---|---|---|---|
| Michael Daniel R | -- | None Available | |
| Michael Daniel R | -- | None Available | |
| Michael Daniel R Jr Co Trustee & D | -- | -- | |
| Michael Darrell W | -- | None Available | |
| Michael Darrell | $126,000 | None Available |
Source: Public Records
Mortgage History
| Date | Status | Borrower | Loan Amount |
|---|---|---|---|
| Closed | Michael Daniel R Jr Co Trustee & D | -- |
Source: Public Records
Tax History Compared to Growth
Tax History
| Year | Tax Paid | Tax Assessment Tax Assessment Total Assessment is a certain percentage of the fair market value that is determined by local assessors to be the total taxable value of land and additions on the property. | Land | Improvement |
|---|---|---|---|---|
| 2024 | $1,611 | $40,220 | $6,760 | $33,460 |
| 2023 | $1,611 | $40,220 | $6,760 | $33,460 |
| 2022 | $1,447 | $34,200 | $4,130 | $30,070 |
| 2021 | $1,606 | $34,200 | $4,130 | $30,070 |
| 2020 | $1,512 | $34,200 | $4,130 | $30,070 |
| 2019 | $1,503 | $32,730 | $3,990 | $28,740 |
| 2018 | $1,548 | $32,730 | $3,990 | $28,740 |
| 2017 | $1,448 | $32,730 | $3,990 | $28,740 |
| 2016 | $1,116 | $33,330 | $3,890 | $29,440 |
| 2014 | $1,160 | $33,330 | $3,890 | $29,440 |
| 2013 | $1,193 | $33,320 | $3,885 | $29,435 |
Source: Public Records
Map
Nearby Homes
- 131 S Lafayette St
- 388 W Hendricks St
- 407 W Central Ave
- 471 Camden West Elkton Rd
- 103 Katherine Ct
- 725 Sr
- 759 Barnetts Mill Rd
- 679 Oxford Germantown Rd
- 1246 Oxford Germantown Rd
- 1222 Oxford Germantown Rd
- 0 Oxford Germantown Rd
- 314 Lakengren Dr
- 820 Lars Cove
- 817 Old Norse Dr
- 0 Lars Cove Unit 1745954
- 105 Mill St
- 805 Brande Dr
- 787 Baltic Dr
- 250 Lakengren Dr
- 0 Valhalla Cove Unit 941078
- 533 West St
- 6.9430ac West St
- 267 S Liberty St
- 221 S Liberty St
- 5 West St
- 271 S Liberty St
- 127 Us
- 217 S Liberty St
- 2 West St
- 195 S Liberty St
- 258 S Liberty St
- 260 S Liberty St
- 264 S Liberty St
- 291 S Liberty St
- 214 S Liberty St
- 191 S Liberty St
- 310 S Liberty St
- 183 S Liberty St
- 153 South St
- 188 S Liberty St