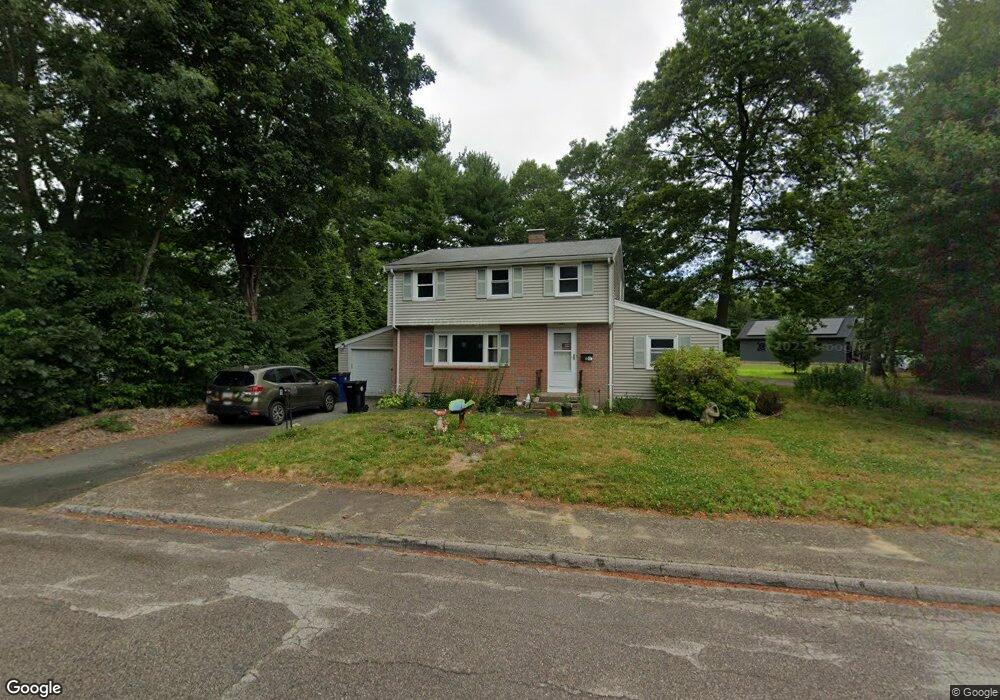
1 West St Sharon, MA 02067
Estimated Value: $702,000 - $759,000
3
Beds
3
Baths
1,811
Sq Ft
$402/Sq Ft
Est. Value
About This Home
This home is located at 1 West St, Sharon, MA 02067 and is currently estimated at $727,369, approximately $401 per square foot. 1 West St is a home located in Norfolk County with nearby schools including Heights Elementary School, Sharon Middle School, and Sharon High School.
Ownership History
Date
Name
Owned For
Owner Type
Purchase Details
Closed on
Feb 27, 2003
Sold by
Mcpherran Gregory and Mcpherran Lisa E
Bought by
West Helen
Current Estimated Value
Home Financials for this Owner
Home Financials are based on the most recent Mortgage that was taken out on this home.
Original Mortgage
$155,000
Outstanding Balance
$62,908
Interest Rate
5.98%
Mortgage Type
Purchase Money Mortgage
Estimated Equity
$664,461
Purchase Details
Closed on
Dec 9, 1994
Sold by
Pevzner Michael and Pevzner Rimma
Bought by
Mcpherran Gregory and Mcpherran Lisa E
Purchase Details
Closed on
Aug 2, 1991
Sold by
Household Finance Two
Bought by
Pevzner Michael and Pevzner Rimma
Purchase Details
Closed on
May 24, 1991
Sold by
Household Fin Corp Two
Bought by
Household Fin Corp Two
Create a Home Valuation Report for This Property
The Home Valuation Report is an in-depth analysis detailing your home's value as well as a comparison with similar homes in the area
Home Values in the Area
Average Home Value in this Area
Purchase History
We collect this data history from publicly available records. To have your information removed, we recommend requesting removal directly through your county’s website.
| Date | Buyer | Sale Price | Title Company |
|---|---|---|---|
| West Helen | $335,000 | -- | |
| West Helen | $335,000 | -- | |
| Mcpherran Gregory | $169,000 | -- | |
| Mcpherran Gregory | $169,000 | -- | |
| Mcpherran Gregory | $169,000 | -- | |
| Pevzner Michael | $142,000 | -- | |
| Pevzner Michael | $142,000 | -- | |
| Household Fin Corp Two | $116,350 | -- | |
| Household Fin Corp Two | $116,350 | -- |
Source: Public Records
Mortgage History
We collect this data history from publicly available records. To have your information removed, we recommend requesting removal directly through your county’s website.
| Date | Status | Borrower | Loan Amount |
|---|---|---|---|
| Open | West Helen | $155,000 | |
| Closed | Household Fin Corp Two | $155,000 | |
| Previous Owner | Household Fin Corp Two | $124,000 |
Source: Public Records
Tax History
| Year | Tax Paid | Tax Assessment Tax Assessment Total Assessment is a certain percentage of the fair market value that is determined by local assessors to be the total taxable value of land and additions on the property. | Land | Improvement |
|---|---|---|---|---|
| 2025 | $10,572 | $604,800 | $382,300 | $222,500 |
| 2024 | $10,045 | $571,400 | $350,700 | $220,700 |
| 2023 | $9,858 | $530,300 | $327,800 | $202,500 |
| 2022 | $9,213 | $466,500 | $273,100 | $193,400 |
| 2021 | $9,106 | $445,700 | $257,700 | $188,000 |
| 2020 | $8,468 | $445,700 | $257,700 | $188,000 |
| 2019 | $8,077 | $416,100 | $228,100 | $188,000 |
| 2018 | $7,973 | $411,600 | $223,600 | $188,000 |
| 2017 | $7,789 | $397,000 | $209,000 | $188,000 |
| 2016 | $7,654 | $380,600 | $209,000 | $171,600 |
| 2015 | $7,176 | $353,500 | $191,600 | $161,900 |
| 2014 | $6,644 | $323,300 | $174,300 | $149,000 |
Source: Public Records
Map
Nearby Homes
- 32 Essex Rd
- 111 E Foxboro St
- 133 Pond St
- 58 Ames St
- 2 East St
- 4 Knife Shop Ln
- 6 Osprey Rd
- 48 Spring Ln
- 30 Ashcroft Rd
- 24 Maskwonicut St
- 180 Old Post Rd Unit 203
- 180 Old Post Rd Unit 206
- 180 Old Post Rd Unit 204
- 180 Old Post Rd Unit 207
- 13 Lyndon Rd
- 77 Azalea Rd
- 167 Morse St
- Lot One Old Wolomolopoag St
- Lot Two Old Wolomolopoag St
- 178 Morse St
Your Personal Tour Guide
Ask me questions while you tour the home.