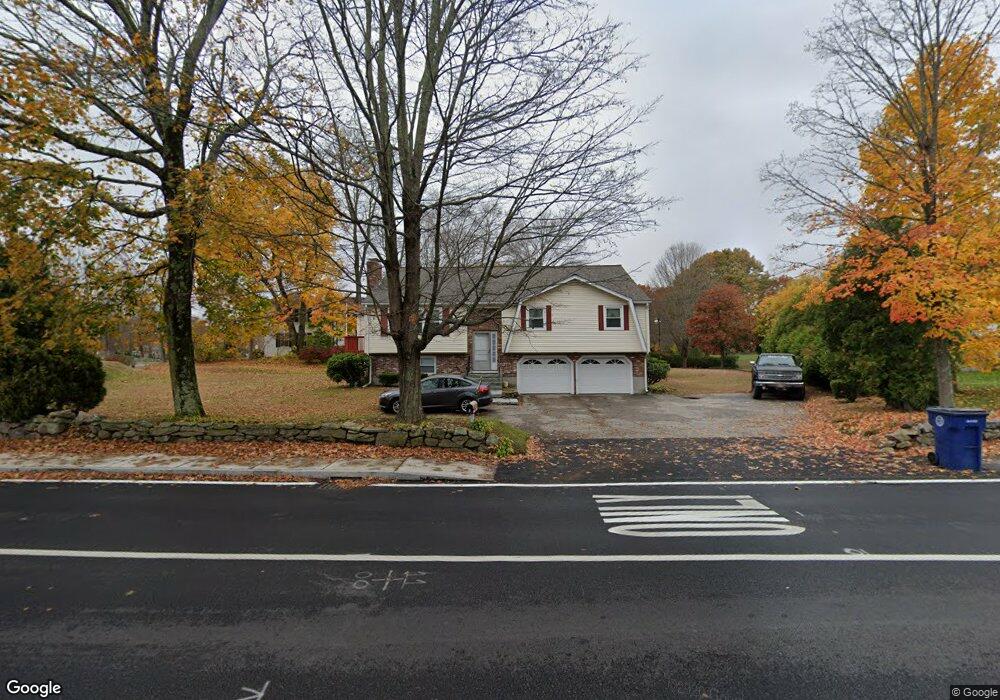
1 Winthrop St Medway, MA 02053
Estimated Value: $634,000 - $678,631
3
Beds
2
Baths
2,262
Sq Ft
$286/Sq Ft
Est. Value
About This Home
This home is located at 1 Winthrop St, Medway, MA 02053 and is currently estimated at $647,408, approximately $286 per square foot. 1 Winthrop St is a home located in Norfolk County with nearby schools including John D. McGovern Elementary School, Burke-Memorial Elementary, and Medway Middle School.
Ownership History
Date
Name
Owned For
Owner Type
Purchase Details
Closed on
Apr 30, 2025
Sold by
Turco Anthony J and Turco Rosa G
Bought by
2025 Turco Ft and Turco
Current Estimated Value
Purchase Details
Closed on
Nov 26, 2024
Sold by
Gengo Joyce
Bought by
Turco Rosa G and Turco Anthony J
Home Financials for this Owner
Home Financials are based on the most recent Mortgage that was taken out on this home.
Original Mortgage
$479,600
Interest Rate
6.63%
Mortgage Type
Purchase Money Mortgage
Purchase Details
Closed on
Aug 5, 2024
Sold by
Grace G Hoag 1996 T G and Grace Atwood
Bought by
Leland Custom Homes Inc
Purchase Details
Closed on
Sep 21, 2021
Sold by
Russo Linda S and Gengo Joyce
Bought by
Gengo Joyce
Purchase Details
Closed on
May 15, 2013
Sold by
Russo Linda S
Bought by
Linda S Russo Ret and Russo Linda S
Create a Home Valuation Report for This Property
The Home Valuation Report is an in-depth analysis detailing your home's value as well as a comparison with similar homes in the area
Home Values in the Area
Average Home Value in this Area
Purchase History
| Date | Buyer | Sale Price | Title Company |
|---|---|---|---|
| 2025 Turco Ft | -- | None Available | |
| 2025 Turco Ft | -- | None Available | |
| Turco Rosa G | $599,500 | None Available | |
| Turco Rosa G | $599,500 | None Available | |
| Turco Rosa G | $599,500 | None Available | |
| Leland Custom Homes Inc | $250,000 | None Available | |
| Gengo Joyce | -- | None Available | |
| Gengo Joyce | -- | None Available | |
| Gengo Joyce | -- | None Available | |
| Russo Linda S | -- | None Available | |
| Russo Linda S | -- | None Available | |
| Linda S Russo Ret | -- | -- | |
| Linda S Russo Ret | -- | -- |
Source: Public Records
Mortgage History
| Date | Status | Borrower | Loan Amount |
|---|---|---|---|
| Previous Owner | Turco Rosa G | $479,600 |
Source: Public Records
Tax History Compared to Growth
Tax History
| Year | Tax Paid | Tax Assessment Tax Assessment Total Assessment is a certain percentage of the fair market value that is determined by local assessors to be the total taxable value of land and additions on the property. | Land | Improvement |
|---|---|---|---|---|
| 2025 | $8,098 | $568,300 | $271,400 | $296,900 |
| 2024 | $8,184 | $568,300 | $271,400 | $296,900 |
| 2023 | $8,303 | $520,900 | $233,800 | $287,100 |
| 2022 | $7,977 | $471,200 | $208,800 | $262,400 |
| 2021 | $7,944 | $455,000 | $187,900 | $267,100 |
| 2020 | $7,506 | $428,900 | $167,000 | $261,900 |
| 2019 | $6,837 | $402,900 | $167,000 | $235,900 |
| 2018 | $6,661 | $377,200 | $146,100 | $231,100 |
| 2017 | $6,530 | $364,400 | $135,700 | $228,700 |
| 2016 | $6,498 | $358,800 | $130,700 | $228,100 |
| 2015 | $6,453 | $353,800 | $123,200 | $230,600 |
| 2014 | $6,097 | $323,600 | $129,400 | $194,200 |
Source: Public Records
Map
Nearby Homes
- 18 Norfolk Ave
- 6 Norfolk Ave
- 37 Maple St
- 329 Village St
- 22 Sunset Dr
- 224 Main St
- 12 Kelley St
- 0 Pond Unit 73416512
- 0 Pond Unit 24285018
- 6 Freedom Trail
- 12 Lovering St
- 2 Kingson Ln Unit 2
- 14 Millstone Dr Unit 14
- 106 Holliston St
- 12 Gorwin Dr
- 14 Richard Rd
- 2 King Phillip St
- 50 Main St
- 12 Longmeadow Ln
- 26 Timber Crest Dr
- 1A Winthrop St
- 3 Winthrop St
- 3 Winthrop St
- 0 Winthrop St
- 4 Winthrop St
- 148 Main St Unit B
- 148 Main St Unit A
- 148 Main St
- 5 Winthrop St
- 4 Winthrop St
- 158 Main St
- 6 Winthrop St
- 7 Winthrop St
- 153 Main St Unit suite 2
- 153 Main St Unit 1A
- 153 Main St Unit Suite 1
- 153 Main St
- 153 Main St Unit 1
- 153 Main St Unit 1B
- 153 Main St Unit 2