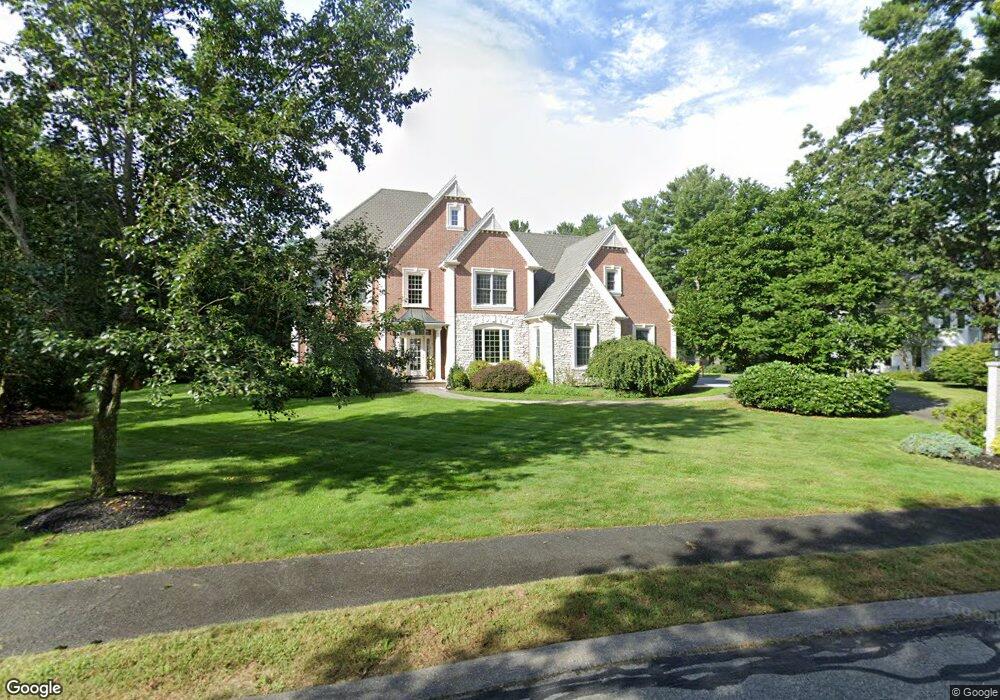
1 Wyman Ln Hopkinton, MA 01748
Estimated Value: $1,633,000 - $1,939,000
4
Beds
5
Baths
5,048
Sq Ft
$355/Sq Ft
Est. Value
About This Home
This home is located at 1 Wyman Ln, Hopkinton, MA 01748 and is currently estimated at $1,793,957, approximately $355 per square foot. 1 Wyman Ln is a home located in Middlesex County with nearby schools including Hopkins Elementary School, Elmwood Elementary School, and Hopkinton Middle School.
Ownership History
Date
Name
Owned For
Owner Type
Purchase Details
Closed on
Sep 2, 2011
Sold by
Altman Melissa H
Bought by
Moore Ivan and Bronfen-Moore Marna
Current Estimated Value
Home Financials for this Owner
Home Financials are based on the most recent Mortgage that was taken out on this home.
Original Mortgage
$417,000
Outstanding Balance
$289,081
Interest Rate
4.52%
Mortgage Type
Purchase Money Mortgage
Estimated Equity
$1,504,876
Purchase Details
Closed on
Jun 11, 2007
Sold by
Hughes-Connell Melissa and Connell Michael P
Bought by
Hughes-Connell Melissa
Purchase Details
Closed on
Dec 29, 2003
Sold by
Weinstein N Daniel and Weinstein Stacey T
Bought by
Monti James F and Monti Victoria L
Home Financials for this Owner
Home Financials are based on the most recent Mortgage that was taken out on this home.
Original Mortgage
$978,500
Interest Rate
6.01%
Mortgage Type
Purchase Money Mortgage
Create a Home Valuation Report for This Property
The Home Valuation Report is an in-depth analysis detailing your home's value as well as a comparison with similar homes in the area
Home Values in the Area
Average Home Value in this Area
Purchase History
| Date | Buyer | Sale Price | Title Company |
|---|---|---|---|
| Moore Ivan | $945,000 | -- | |
| Hughes-Connell Melissa | -- | -- | |
| Monti James F | $1,030,000 | -- |
Source: Public Records
Mortgage History
| Date | Status | Borrower | Loan Amount |
|---|---|---|---|
| Open | Moore Ivan | $417,000 | |
| Previous Owner | Monti James F | $978,500 |
Source: Public Records
Tax History Compared to Growth
Tax History
| Year | Tax Paid | Tax Assessment Tax Assessment Total Assessment is a certain percentage of the fair market value that is determined by local assessors to be the total taxable value of land and additions on the property. | Land | Improvement |
|---|---|---|---|---|
| 2025 | $21,681 | $1,529,000 | $482,000 | $1,047,000 |
| 2024 | $21,376 | $1,463,100 | $459,300 | $1,003,800 |
| 2023 | $20,891 | $1,321,400 | $379,600 | $941,800 |
| 2022 | $20,523 | $1,205,100 | $345,200 | $859,900 |
| 2021 | $6,722 | $1,167,000 | $335,600 | $831,400 |
| 2020 | $6,419 | $1,134,000 | $327,800 | $806,200 |
| 2019 | $18,880 | $1,099,600 | $303,800 | $795,800 |
| 2018 | $6,035 | $1,071,100 | $297,700 | $773,400 |
| 2017 | $5,891 | $1,039,400 | $288,900 | $750,500 |
| 2016 | $17,233 | $1,011,900 | $283,300 | $728,600 |
| 2015 | $17,130 | $953,800 | $275,100 | $678,700 |
Source: Public Records
Map
Nearby Homes
- 11 N Mill St
- 10 Clinton St
- 2 Curtis Rd
- 68 E Main St
- 3 Fitch Ave Unit 14
- 4 Myrtle Ave Unit 20
- 101 Olive St
- 5 Myrtle Ave Unit 2
- 11 Fitch Ave Unit 18
- 7 Myrtle Ave Unit 3
- 13 Fitch Ave
- 13 Fitch Ave Unit 19
- 10 Fitch Ave Unit 9
- 12 Fitch Ave Unit 8
- 14 Fitch Ave Unit 7
- 16 Fitch Ave Unit 6
- 11 Myrtle Ave Unit 5
- 31 Cherry Ln Unit 31
- 60 Frankland Rd
- 28-30 Olive St
- 3 Wyman Ln
- 4 Wyman Ln
- 4 Alprilla Farm Rd
- 2 Alprilla Farm Rd
- 50 Front St
- 5 Wyman Ln
- 52 Front St
- 6 Alprilla Farm Rd
- 44 Front St
- 6 Wyman Ln
- 7 Wyman Ln
- 55 Front St
- 43 Front St
- 8 Alprilla Farm Rd
- 3 Alprilla Farm Rd
- 5 Alprilla Farm Rd
- 0 Lot 1 Mill N Unit 50380397
- 41 Front St
- 60 Front St
- 7 Alprilla Farm Rd