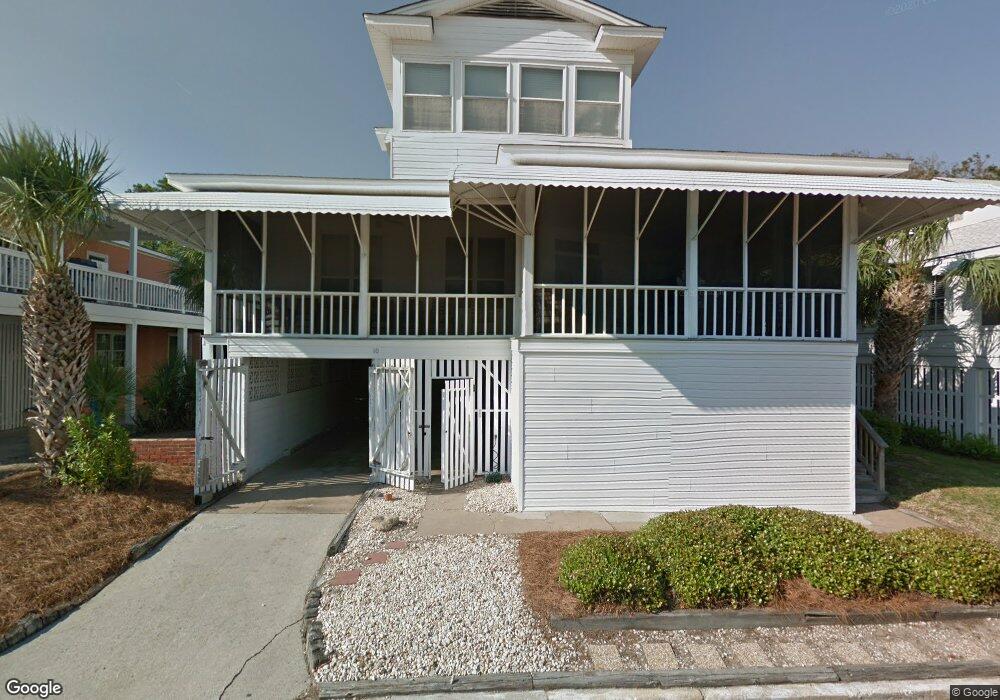
10 10th St Tybee Island, GA 31328
Estimated Value: $951,000 - $1,010,000
5
Beds
3
Baths
1,564
Sq Ft
$629/Sq Ft
Est. Value
About This Home
This home is located at 10 10th St, Tybee Island, GA 31328 and is currently estimated at $984,166, approximately $629 per square foot. 10 10th St is a home located in Chatham County with nearby schools including Howard Elementary School, Coastal Middle School, and Islands High School.
Ownership History
Date
Name
Owned For
Owner Type
Purchase Details
Closed on
Jun 1, 2022
Sold by
Best Julie Hug
Bought by
Mullet Enterprises Llc
Current Estimated Value
Home Financials for this Owner
Home Financials are based on the most recent Mortgage that was taken out on this home.
Original Mortgage
$570,000
Outstanding Balance
$542,357
Interest Rate
5.27%
Mortgage Type
New Conventional
Estimated Equity
$441,809
Purchase Details
Closed on
Jan 16, 2012
Bought by
Goodman Jeffrey Thomas
Purchase Details
Closed on
May 1, 2008
Sold by
Not Provided
Bought by
Mullet Enterprises Llc
Create a Home Valuation Report for This Property
The Home Valuation Report is an in-depth analysis detailing your home's value as well as a comparison with similar homes in the area
Home Values in the Area
Average Home Value in this Area
Purchase History
| Date | Buyer | Sale Price | Title Company |
|---|---|---|---|
| Mullet Enterprises Llc | -- | -- | |
| Best Julie Hug | $775,000 | -- | |
| Goodman Jeffrey Thomas | -- | -- | |
| Goodman Jeffrey Thomas | -- | -- | |
| Mullet Enterprises Llc | -- | -- |
Source: Public Records
Mortgage History
| Date | Status | Borrower | Loan Amount |
|---|---|---|---|
| Open | Mullet Enterprises Llc | $570,000 |
Source: Public Records
Tax History Compared to Growth
Tax History
| Year | Tax Paid | Tax Assessment Tax Assessment Total Assessment is a certain percentage of the fair market value that is determined by local assessors to be the total taxable value of land and additions on the property. | Land | Improvement |
|---|---|---|---|---|
| 2025 | $10,266 | $316,520 | $195,000 | $121,520 |
| 2024 | $10,266 | $317,720 | $195,000 | $122,720 |
| 2023 | $9,777 | $308,520 | $195,000 | $113,520 |
| 2022 | $5,943 | $265,520 | $195,000 | $70,520 |
| 2021 | $5,893 | $176,840 | $108,160 | $68,680 |
| 2020 | $6,043 | $175,880 | $99,840 | $76,040 |
| 2019 | $9,042 | $175,880 | $99,840 | $76,040 |
| 2018 | $5,579 | $174,600 | $99,840 | $74,760 |
| 2017 | $5,586 | $172,960 | $99,840 | $73,120 |
| 2016 | $5,585 | $173,360 | $99,840 | $73,520 |
| 2015 | $4,965 | $153,880 | $100,880 | $53,000 |
| 2014 | $7,555 | $158,240 | $0 | $0 |
Source: Public Records
Map
Nearby Homes