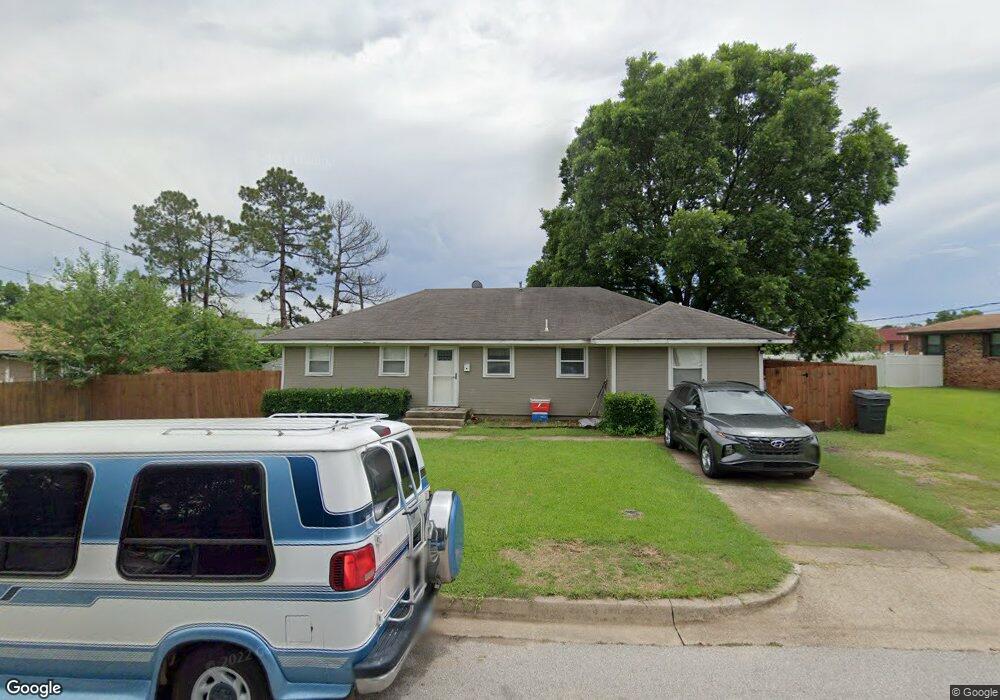
10 15th Ave NW Ardmore, OK 73401
Estimated Value: $117,000 - $171,000
2
Beds
2
Baths
1,326
Sq Ft
$104/Sq Ft
Est. Value
About This Home
This home is located at 10 15th Ave NW, Ardmore, OK 73401 and is currently estimated at $138,485, approximately $104 per square foot. 10 15th Ave NW is a home located in Carter County with nearby schools including Charles Evans Elementary School, Ardmore Middle School, and Ardmore High School.
Ownership History
Date
Name
Owned For
Owner Type
Purchase Details
Closed on
Apr 24, 2012
Sold by
Sanderson Jerry S and Sanderson Ashley
Bought by
Loughridge Carla A
Current Estimated Value
Home Financials for this Owner
Home Financials are based on the most recent Mortgage that was taken out on this home.
Original Mortgage
$82,065
Outstanding Balance
$56,438
Interest Rate
3.97%
Mortgage Type
FHA
Estimated Equity
$82,047
Purchase Details
Closed on
May 12, 2008
Sold by
Baxter Jason and Baxter Kimberly R
Bought by
Sanderson Jerry S
Home Financials for this Owner
Home Financials are based on the most recent Mortgage that was taken out on this home.
Original Mortgage
$79,868
Interest Rate
5.86%
Mortgage Type
FHA
Purchase Details
Closed on
Aug 2, 2004
Sold by
Secretary Of Housing And
Bought by
Baxter Jason
Purchase Details
Closed on
Feb 24, 1999
Sold by
Hammer Cathryn and Hammer Warre
Bought by
Johnson Micheal Creig An
Create a Home Valuation Report for This Property
The Home Valuation Report is an in-depth analysis detailing your home's value as well as a comparison with similar homes in the area
Purchase History
| Date | Buyer | Sale Price | Title Company |
|---|---|---|---|
| Loughridge Carla A | $84,500 | None Available | |
| Sanderson Jerry S | $80,500 | -- | |
| Baxter Jason | -- | -- | |
| Johnson Micheal Creig An | $38,500 | -- |
Source: Public Records
Mortgage History
| Date | Status | Borrower | Loan Amount |
|---|---|---|---|
| Open | Loughridge Carla A | $82,065 | |
| Previous Owner | Sanderson Jerry S | $79,868 |
Source: Public Records
Tax History
| Year | Tax Paid | Tax Assessment Tax Assessment Total Assessment is a certain percentage of the fair market value that is determined by local assessors to be the total taxable value of land and additions on the property. | Land | Improvement |
|---|---|---|---|---|
| 2025 | $1,318 | $13,211 | $1,500 | $11,711 |
| 2024 | $1,319 | $12,750 | $1,500 | $11,250 |
| 2023 | $1,273 | $12,144 | $1,500 | $10,644 |
| 2022 | $1,106 | $11,565 | $1,500 | $10,065 |
| 2021 | $1,111 | $11,015 | $1,500 | $9,515 |
| 2020 | $1,060 | $10,660 | $960 | $9,700 |
| 2019 | $1,053 | $10,845 | $960 | $9,885 |
| 2018 | $1,029 | $10,427 | $357 | $10,070 |
| 2017 | $983 | $10,748 | $357 | $10,391 |
| 2016 | $954 | $10,237 | $357 | $9,880 |
| 2015 | $749 | $9,749 | $357 | $9,392 |
| 2014 | $953 | $10,647 | $357 | $10,290 |
Source: Public Records
Map
Nearby Homes
- 45 15th Ave NW
- 1409 Mount Washington Rd
- 11 Turner St
- 205 15th Ave NW
- 1618 Mount Washington Rd
- 1415 Holt St
- 230 13th Ave NW
- 1737 Winchester St
- 312 Wandering Way
- 111 Lost Creek Ln
- 1740 Tiverton St
- 209 11th Ave NW
- 116 11th Ave NW
- 4015 Hwy 177
- 412 Wandering Way
- 0 NE 10th Ave Unit 2517786
- 1722 Quiet Ln
- 113 10th Ave NE
- 421 Elm St
- 906 B St NW
- 1421 N Washington St
- 1425 N Washington St
- 1501 N Washington St
- 33 15th Ave NW
- 27 15th Place NW
- 20 15th Ave NW
- 39 15th Ave NW
- 35 15th Ave NW
- 1509 N Washington St
- 1460 N Washington St
- 41 15th Ave NW
- 1456 N Washington St
- 1452 N Washington St
- 43 15th Ave NW
- 1448 N Washington St
- 1500 N Washington St
- 8 15th Ave NE
- 1607 N Washington St
- 9 Hillcrest St
Your Personal Tour Guide
Ask me questions while you tour the home.