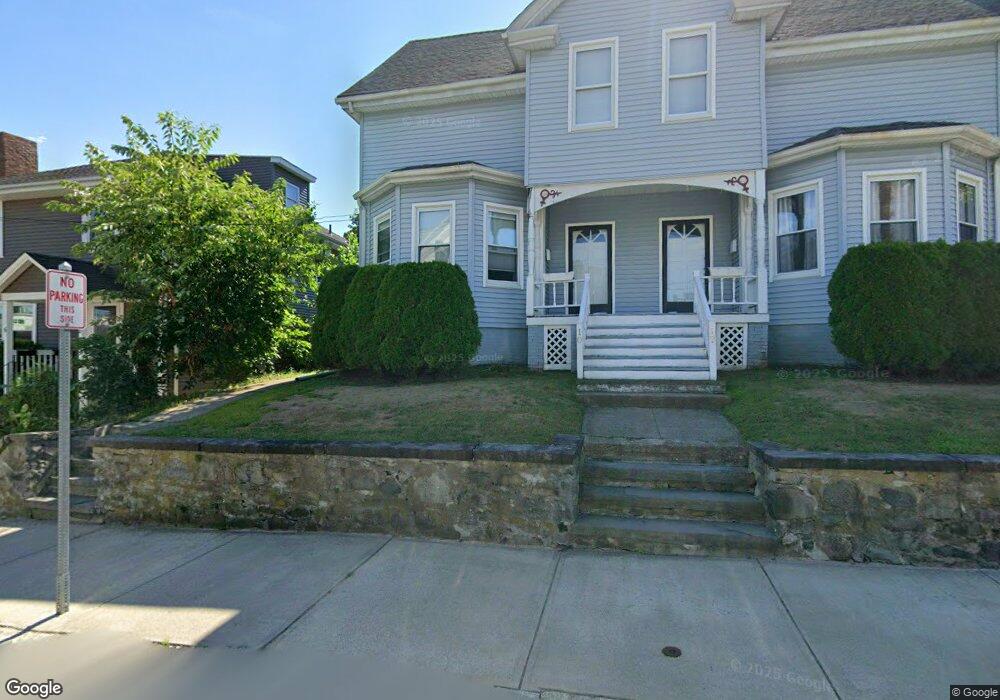
10 2nd St Attleboro, MA 02703
Estimated Value: $553,664 - $699,000
6
Beds
2
Baths
2,866
Sq Ft
$216/Sq Ft
Est. Value
About This Home
This home is located at 10 2nd St, Attleboro, MA 02703 and is currently estimated at $618,166, approximately $215 per square foot. 10 2nd St is a home located in Bristol County with nearby schools including Thomas E. Willett School, Cyril K. Brennan Middle School, and Attleboro High School.
Ownership History
Date
Name
Owned For
Owner Type
Purchase Details
Closed on
Feb 20, 1996
Sold by
Fhlmc
Bought by
Peirce Ronald B and Cloutier Shirley A
Current Estimated Value
Home Financials for this Owner
Home Financials are based on the most recent Mortgage that was taken out on this home.
Original Mortgage
$117,700
Outstanding Balance
$3,084
Interest Rate
6.99%
Mortgage Type
Purchase Money Mortgage
Estimated Equity
$615,082
Purchase Details
Closed on
Jun 14, 1995
Sold by
Ogrady Peter R and Ogrady Fhlmc
Bought by
Fhlmc
Create a Home Valuation Report for This Property
The Home Valuation Report is an in-depth analysis detailing your home's value as well as a comparison with similar homes in the area
Home Values in the Area
Average Home Value in this Area
Purchase History
| Date | Buyer | Sale Price | Title Company |
|---|---|---|---|
| Peirce Ronald B | $123,900 | -- | |
| Fhlmc | $102,453 | -- |
Source: Public Records
Mortgage History
| Date | Status | Borrower | Loan Amount |
|---|---|---|---|
| Open | Fhlmc | $117,700 |
Source: Public Records
Tax History Compared to Growth
Tax History
| Year | Tax Paid | Tax Assessment Tax Assessment Total Assessment is a certain percentage of the fair market value that is determined by local assessors to be the total taxable value of land and additions on the property. | Land | Improvement |
|---|---|---|---|---|
| 2025 | $6,153 | $490,300 | $108,100 | $382,200 |
| 2024 | $6,432 | $505,300 | $108,100 | $397,200 |
| 2023 | $5,603 | $409,300 | $98,300 | $311,000 |
| 2022 | $5,693 | $394,000 | $93,600 | $300,400 |
| 2021 | $4,746 | $320,700 | $90,000 | $230,700 |
| 2020 | $4,605 | $316,300 | $87,300 | $229,000 |
| 2019 | $4,012 | $283,300 | $85,600 | $197,700 |
| 2018 | $3,960 | $267,200 | $83,100 | $184,100 |
| 2017 | $3,571 | $245,400 | $83,100 | $162,300 |
| 2016 | $3,677 | $248,100 | $81,500 | $166,600 |
| 2015 | $3,229 | $219,500 | $81,500 | $138,000 |
| 2014 | $3,672 | $247,300 | $77,700 | $169,600 |
Source: Public Records
Map
Nearby Homes